. 2025 Oct;17(10):2691-2712.
doi: 10.1038/s44321-025-00298-0. Epub 2025 Aug 29.

Pyrin inflammasome-driven erosive arthritis caused by unprenylated RHO GTPase signaling

Affiliations

Pyrin inflammasome-driven erosive arthritis caused by unprenylated RHO GTPase signaling

Murali K Akula et al. EMBO Mol Med. 2025 Oct.

Abstract

Geranylgeranyl pyrophosphate, a non-sterol intermediate of the mevalonate pathway, serves as the substrate for protein geranylgeranylation, a process catalyzed by geranylgeranyl transferase I (GGTase-I). Myeloid-specific deletion of Pggt1b, the gene coding for GGTase-I, leads to spontaneous and severe erosive arthritis in mice; however, the underlying mechanisms remained unclear. In this study, we demonstrate that arthritis in mice with myeloid-specific Pggt1b deficiency is driven by unprenylated GTP-bound small RHO family GTPases, which in turn trigger Pyrin (Mefv) inflammasome activation, GSDMD-dependent macrophage pyroptosis, and IL-1β secretion. We show that although Pggt1b deficiency leads to hyperactivation of RAC1, impaired prenylation alters its proper membrane localization and interaction with effectors, rendering it effectively inactive in vivo. Consequently, unprenylated RHO family signaling promotes Pyrin inflammasome assembly through recruitment to the RAC1 effector IQGAP1. Together, these findings identify a novel inflammatory axis in which non-prenylated RHO GTPase activity promotes spontaneous Pyrin inflammasome activation, pyroptosis, and IL-1β release in macrophages, contributing to inflammatory arthritis in mice.

Keywords: Arthritis; Prenylation; Pyrin Inflammasome; Pyroptosis; RHO Family GTPases.


Conflict of interest statement

Disclosure and competing interests statement. The authors declare no competing interests.

Figures

Figure 1
Figure 1. MyD88-dependent IL-1β signaling mediates arthritis development in Pggt1bΔ/Δ mice.
(A) Histological images of haematoxylin and eosin-stained knee joints of 20-week-old Il1r1+/+Pggt1b+/+, Il1r1+/+Pggt1bΔ/Δ, and Il1r1−/−Pggt1bΔ/Δ mice. Representative pictures are shown. Scalebar, 200 µm. Arrows depict inflammation as shown by the accumulation of infiltrating leukocytes. (B) Infiltrate and exudate femur and tibia scores, each ranging from 0 (normal) to 3 (severely inflamed), of Il1r1+/+Pggt1b+/+ (n = 6), Il1r1+/+Pggt1bΔ/Δ (n = 11), Il1r1−/−Pggt1bΔ/Δ (n = 7). Dots in the graphs indicate individual mice, and data are expressed as mean ± s.e.m. (C) Histological images of haematoxylin and eosin-stained knee joints of 20-week-old Myd88+/+Pggt1b+/+, Myd88+/+Pggt1bΔ/Δ, and Myd88−/−Pggt1bΔ/Δ mice. Representative pictures are shown. Scalebar, 200 µm. Arrows depict inflammation. (D) Infiltrate and exudate femur and tibia scores, each ranging from 0 (normal) to 3 (severely inflamed), of Myd88+/+Pggt1b+/+ (n = 5), Myd88+/+Pggt1bΔ/Δ (n = 4), and Myd88−/−Pggt1bΔ/Δ (n = 6). Dots in the graphs indicate individual mice, and data are expressed as mean ± s.e.m. Significance between groups was calculated by one-way ANOVA and Dunnett’s multiple comparison test. Source data are available online for this figure.
Figure 2
Figure 2. GSDMD-mediated pyroptosis drives IL-1β production in Pggt1bΔ/Δ macrophages.
(A) Western blots showing levels of pro- and bioactive IL-1β, pro- and active caspase-1 (CASP1), and full length and cleaved (cl) GSDMD in supernatants and lysates of LPS-stimulated bone marrow-derived macrophages (BMDMs) isolated from Pggt1b+/+ and Pggt1bΔ/Δ mice. Actin was used as a loading control. (B) IL-1β cytokine levels, 8 h after LPS stimulation, in supernatants of BMDMs isolated from Pggt1b+/+ (n = 3 biological replicates) and Pggt1bΔ/Δ (n = 3) mice. (C) Percentage (%) of cell death measured as LDH release in supernatants 8 h after LPS stimulation of BMDMs isolated from Pggt1b+/+ (n = 3 biological replicates) and Pggt1bΔ/Δ (n = 3). (D) Western blots showing levels of pro- and bioactive IL-1β, pro- and active CASP1, and full length and cleaved (cl) GSDMD in supernatants and lysates of LPS-stimulated BMDMs isolated from Pggt1b+/+, Pggt1bΔ/Δ, and Asc−/−Pggt1bΔ/Δ mice. Actin was used as a loading control. (E) IL-1β cytokine levels, 8 h after LPS stimulation, in supernatants of BMDMs isolated from Pggt1b+/+ (n = 4 biological replicates), Pggt1bΔ/Δ (n = 5), and Asc−/−Pggt1bΔ/Δ (n = 4) mice. (F) Western blots showing levels of pro- and bioactive IL-1β, pro- and active CASP1, and full length and cleaved (cl) GSDMD in supernatants and lysates of LPS-stimulated BMDMs isolated from Pggt1b+/+, Pggt1bΔ/Δ, and Casp1−/−Pggt1bΔ/Δ mice. Actin was used as a loading control. (G) IL-1β cytokine levels, 8 h after LPS stimulation, in supernatants of BMDMs isolated from Pggt1b+/+ (n = 4 biological replicates), Pggt1bΔ/Δ (n = 5), and Casp1−/−Pggt1bΔ/Δ (n = 4) mice. (H) Western blots showing levels of pro- and bioactive IL-1β, pro- and active CASP1, and full length and cleaved (cl) GSDMD in supernatants and lysates of LPS-stimulated BMDMs isolated from Pggt1b+/+, Pggt1bΔ/Δ, and Gsdmd−/−Pggt1bΔ/Δ mice. Actin was used as a loading control. (I) IL-1β cytokine levels, 8 h after LPS stimulation, in supernatants of BMDMs isolated from Pggt1b+/+ (n = 4 biological replicates), Pggt1bΔ/Δ (n = 4), and Gsdmd−/−Pggt1bΔ/Δ (n = 4) mice. Significance between groups was calculated by two-tailed Student’s t test (B, C), one-way ANOVA with Dunnett’s multiple comparisons test (E, G, I). Data are expressed as mean ± s.e.m. Western blots are representative of two independent experiments using biological replicates. Source data are available online for this figure.
Figure 3
Figure 3. Pyrin but not Nlrp3 mediates inflammasome activation in Pggt1bΔ/Δ macrophages.
(A) Western blots showing levels of Pyrin and Nlrp3 in lysates from LPS-stimulated BMDMs isolated from Pggt1b+/+ and Pggt1bΔ/Δ mice. Actin was used as a loading control. (B) Western blots showing levels of Pyrin in lysates from LPS-stimulated BMDMs isolated from Pggt1b+/+, Pggt1bΔ/Δ, and Myd88−/−Pggt1bΔ/Δ mice. Actin was used as a loading control. (C) Western blots showing levels of Pyrin in lysates from LPS-stimulated Pggt1b+/+ and Pggt1bΔ/Δ macrophages, in the presence or absence of recombinant mouse interleukin-1 receptor (IL-1R) antagonist (50 ng/ml). Actin was used as a loading control. (D) Western blots showing levels of pro- and bioactive-IL-1β, pro- and active-CASP1 and full length and cleaved (cl) GSDMD in supernatants and lysates from LPS-stimulated BMDMs isolated from Pggt1b+/+, Pggt1bΔ/Δ and Mefv−/−Pggt1bΔ/Δ macrophages. Actin was used as a loading control. (E) IL-1β cytokine levels, 8 h after LPS stimulation, in supernatants isolated from Pggt1b+/+ (n = 4 biological replicates), Pggt1bΔ/Δ (n = 4), and Mefv−/−Pggt1bΔ/Δ (n = 4) macrophages. Data are expressed as mean ± s.e.m. (F) Western blots showing levels of pro- and bioactive-IL-1β, pro- and active-CASP1 and full length and cleaved (cl) GSDMD in supernatants and lysates from LPS-stimulated BMDMs isolated from Pggt1b+/+, Pggt1bΔ/Δ, and Nlrp3−/−Pggt1bΔ/Δ macrophages. Actin was used as a loading control. (G) IL-1β cytokine levels, 8 h after LPS stimulation, in supernatants isolated from Pggt1b+/+ (n = 3 biological replicates), Pggt1bΔ/Δ (n = 3), and Nlrp3−/−Pggt1bΔ/Δ (n = 3) macrophages. Data are expressed as mean ± s.e.m. Significance between groups was calculated by one-way ANOVA and Dunnett’s multiple comparison test. Western blots are representative of two independent experiments (except for C) using biological replicates. Source data are available online for this figure.
Figure 4
Figure 4. Pyrin-mediated GSDMD signaling mediates arthritis development in Pggt1bΔ/Δ mice.
(A) Histological images of haematoxylin and eosin-stained knee joints of 20-week-old Pggt1b+/+, Pggt1bΔ/Δ, and Asc−/−Pggt1bΔ/Δ mice. Representative pictures are shown. Scalebar, 200 µm. Arrows depict inflammation, as shown by the accumulation of infiltrating leukocytes. (B) Infiltrate and exudate femur and tibia scores, each ranging from 0 (normal) to 3 (severely inflamed), of Asc+/+Pggt1b+/+ (n = 4), Asc+/+Pggt1bΔ/Δ (n = 9), and Asc−/−Pggt1bΔ/Δ (n = 5) at the age of 20 weeks. Dots in the graphs indicate individual mice, and data are expressed as mean ± s.e.m. (C) Histological images of haematoxylin and eosin-stained knee joints of Pggt1b+/+, Pggt1bΔ/Δ, and Casp1−/−Pggt1bΔ/Δ mice. Representative pictures are shown. Scalebar, 200 µm. Arrows depict inflammation. (D) Infiltrate and exudate femur and tibia scores, each ranging from 0 (normal) to 3 (severely inflamed), of Casp1+/+Pggt1b+/+ (n = 4), Casp1+/+Pggt1bΔ/Δ (n = 8), and Casp1−/−Pggt1bΔ/Δ (n = 7) at the age of 20 weeks. Dots in the graphs indicate individual mice, and data are expressed as mean ± s.e.m. (E) Histological images of haematoxylin and eosin-stained knee joints of Pggt1b+/+, Pggt1bΔ/Δ, and Gsdmd−/−Pggt1bΔ/Δ mice. Representative pictures are shown. Scalebar, 200 µm. Arrows depict inflammation. (F) Infiltrate and exudate femur and tibia scores, each ranging from 0 (normal) to 3 (severely inflamed), of Gsdmd+/+Pggt1b+/+ (n = 5), Gsdmd+/+Pggt1bΔ/Δ (n = 10), and Gsdmd−/−Pggt1bΔ/Δ (n = 8) at the age of 20 weeks. Dots in the graphs indicate individual mice, and data are expressed as mean ± s.e.m. (G) Histological images of haematoxylin and eosin-stained knee joints of Pggt1b+/+, Pggt1bΔ/Δ, and Mefv−/−Pggt1bΔ/Δ mice. Representative pictures are shown. Scalebar, 200 µm. Arrows depict inflammation. (H) Infiltrate and exudate femur and tibia scores, each ranging from 0 (normal) to 3 (severely inflamed), of Mefv+/+Pggt1b+/+ (n = 7), Mefv+/+Pggt1bΔ/Δ (n = 9), and Mefv−/−Pggt1bΔ/Δ (n = 7) at the age of 20 weeks. Dots in the graphs indicate individual mice, and data are expressed as mean ± s.e.m. Significance between groups was calculated by one-way ANOVA and Dunnett’s multiple comparison test. Source data are available online for this figure.
Figure 5
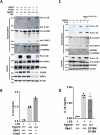
Figure 5. RAC1 but not RHOA activates the Pyrin inflammasome in Pggt1bΔ/Δ macrophages.
(A) IL-1β cytokine levels, 8 h after LPS stimulation, in supernatants of BMDMs isolated from Pggt1b+/+ (n = 3 biological replicates), and Pggt1bΔ/Δ (n = 3) mice, after treatment with EHT1864 or CCG1423. (B) Western blots showing levels of pro- and bioactive IL-1β, pro- and active CASP1, and full length and cleaved (cl) GSDMD, in supernatants and lysates of LPS-stimulated BMDMs after treatment with EHT1864. Actin was used as a loading control. (C) Western blots showing levels of pro- and bioactive IL-1β, pro- and active CASP1, and full length and cleaved (cl) GSDMD, in supernatants and lysates of LPS-stimulated BMDMs after treatment with CCG1423. Actin was used as a loading control. (D) IL-1β cytokine levels, 8 h after LPS stimulation, in supernatants of BMDMs, isolated from Pggt1b+/+ (n = 3 biological replicates) and Pggt1bΔ/Δ (n = 3) mice, after treatment with SB203580. Data are expressed as mean ± s.e.m. Significance between groups was calculated by one-way ANOVA and Dunnett’s multiple comparison test. (E) Western blots showing levels of pro- and bioactive IL-1β, pro- and active CASP1, and full length and cleaved (cl) GSDMD, in supernatants and lysates of LPS-stimulated BMDMs after treatment with SB203580. Actin was used as a loading control. Western blots are representative of two independent experiments (except for C) using biological replicates. Source data are available online for this figure.
Figure 6
Figure 6. Microtubule dynamics mediate Pyrin activation.
(A) Western blots showing levels of pro- and bioactive-IL-1β, pro- and active-CASP1 and full length and cleaved (cl) GSDMD in supernatants and lysates from LPS-stimulated BMDMs isolated from Pggt1b+/+ and Pggt1bΔ/Δ mice either pretreated or not with colchicine. (B) IL-1β cytokine levels, 8 h after LPS stimulation, in supernatants of BMDMs isolated from Pggt1b+/+ (n = 4 biological replicates) and Pggt1bΔ/Δ (n = 4) mice either pretreated or not with colchicine. (C) Western blots showing levels of pro- and bioactive-IL-1β, pro- and active-CASP1 and full length and cleaved (cl) GSDMD in supernatants and lysates from LPS-stimulated BMDMs isolated from Pggt1b+/+ and Pggt1bΔ/Δ mice either pretreated or not with arachidonic acid (AA). (D) IL-1β cytokine levels, 8 h after LPS stimulation, in supernatants of BMDMs isolated from Pggt1b+/+ (n = 4 biological replicates) and Pggt1bΔ/Δ (n = 4) mice either pretreated or not with AA. (E) Western blots showing levels of pro- and bioactive-IL-1β, pro- and active-CASP1 and full length and cleaved (cl) GSDMD in supernatants and lysates from LPS-stimulated BMDMs isolated from Pggt1b+/+ and Pggt1bΔ/Δ mice either pretreated or not with Bryostatin (BST). (F) IL-1β cytokine levels, 8 h after LPS stimulation, in supernatants of BMDMs isolated from Pggt1b+/+ (n = 4 biological replicates) and Pggt1bΔ/Δ (n = 4) mice either pretreated or not with BST. Data are expressed as mean ± s.e.m. Significance between groups was calculated by one-way ANOVA and Dunnett’s multiple comparison test. Western blots are representative of two independent experiments using biological replicates. Source data are available online for this figure.
Figure 7
Figure 7. IQGAP1 mediates Pyrin inflammasome activation in Pggt1bΔ/Δ macrophages.
(A) Western blots showing levels of IQGAP1 and actin in cellular lysates isolated from Pggt1b+/+ and Pggt1bΔ/Δ-HoxB8 cells either transfected or not with a control single guide (sg) RNA or with IQGAP1-sgRNAs. (B) IL-1β cytokine levels in supernatants from Pggt1b+/+ (n = 3), Pggt1bΔ/Δ (n = 3), and Iqgap1−/−Pggt1bΔ/Δ (n = 3) macrophages 8 h after LPS stimulation. (C) Western blots showing levels of pro- and bioactive-IL-1β, pro- and cleaved (cl) CASP1 and full length and cleaved (cl) GSDMD in supernatants and lysates isolated from Pggt1b+/+, Pggt1bΔ/Δ and Iqgap1−/−Pggt1bΔ/Δ macrophages. (D) Percentage (%) of cell death, measured as LDH release in supernatants, 8 h after LPS stimulation of Pggt1b+/+ (n = 3), Pggt1bΔ/Δ (n = 3), and Iqgap1−/−Pggt1bΔ/Δ (n = 3) macrophages. (E) Immunoprecipitation (IP) of IQGAP1 in Pggt1b+/+ and Pggt1bΔ/Δ macrophage lysates followed by Western blotting for Pyrin and IQGAP1. (F) Immunoprecipitation (IP) of IQGAP1 in Pggt1b+/+ and Pggt1bΔ/Δ macrophage lysates either pretreated or not with EHT1864, arachidonic acid (AA), or Bryostatin (BST) followed by western blotting for Pyrin and IQGAP1. Actin was used as a loading control. Data are expressed as mean ± s.e.m. Western blots are representative of two independent experiments (except for F) using biological replicates. Source data are available online for this figure.
Figure EV1
Figure EV1. TNF does not drive arthritis development in Pggt1bΔ/Δ mice.
(A) Histological images of haematoxylin and eosin-stained knee joints of 20-week-old Pggt1b+/+, Pggt1bΔ/Δ, and Tnfr−/−Pggt1bΔ/Δ mice. Representative pictures are shown. Scalebar, 200 µm. Arrows depict inflammation, as shown by the accumulation of infiltrating leukocytes. (B) Histological scores for inflammation and exudate at the femur and tibia, each ranging from 0 (normal) to 3 (severely inflamed), of Pggt1b+/+ (n = 4), Pggt1bΔ/Δ (n = 6), and Tnfr−/−Pggt1bΔ/Δ (n = 8). Dots in the graphs indicate individual mice, and data are expressed as mean ± s.e.m. Significance between groups was calculated by one-way ANOVA and Dunnett’s multiple comparison test. Source data are available online for this figure.
Figure EV2
Figure EV2. Neither apoptosis nor necroptosis mediates inflammasome activation in Pggt1bΔ/Δ macrophages.
(A) Western blots showing levels of pro- and active-IL-1β, pro- and active-CASP1 and full length and cleaved (cl) GSDMD in supernatants and lysates from BMDMs isolated from Pggt1b+/+, Pggt1bΔ/Δ, and Casp8−/−Ripk3−/−Pggt1bΔ/Δ mice either stimulated or not with LPS for 8 h. Actin was used as a loading control. (B) IL-1β levels in supernatants from BMDMs, isolated from Pggt1b+/+ (n = 4 biological replicates), Pggt1bΔ/Δ (n = 4) and Casp8−/−Ripk3−/−Pggt1bΔ/Δ (n = 4) mice after treatment with LPS for 8 h. (C) Western blots showing levels of pro- and active-IL-1β, pro- and active-CASP1 and full length and cleaved (cl) GSDMD in supernatants and lysates from BMDMs isolated from Pggt1b+/+, Pggt1bΔ/Δ and Ripk1D138N/D138NPggt1bΔ/Δ mice either stimulated or not with LPS for 8 h. Actin was used as a loading control. (D) IL-1β levels in supernatants from BMDMs, isolated from Pggt1b+/+ (n = 4 biological replicates), Pggt1bΔ/Δ (n = 4), and Ripk1D138N/D138NPggt1bΔ/Δ (n = 4) mice after treatment with LPS for 8 h. Significance between groups was calculated by one-way ANOVA with Dunnett’s multiple comparison test. Source data are available online for this figure.
Figure EV3
Figure EV3. Pyrin-mediated GSDMD signaling drives arthritis development in Pggt1bΔ/Δ mice.
IL-18 cytokine levels in serum of Pggt1b+/+ (n = 7 biological replicates), Asc+/+Pggt1bΔ/Δ (n = 3), Asc−/−Pggt1bΔ/Δ (n = 4), Casp1+/+Pggt1bΔ/Δ (n = 4), Casp1−/−Pggt1bΔ/Δ (n = 5), Gsdmd+/+Pggt1bΔ/Δ (n = 5), Gsdmd−/−Pggt1bΔ/Δ (n = 5), Mefv+/+Pggt1bΔ/Δ (n = 7), and Mefv−/−Pggt1bΔ/Δ (n = 5). Data are expressed as mean ± s.e.m. Significance between groups was calculated by one-way ANOVA and Dunnett’s multiple comparison test. Source data are available online for this figure.
Figure EV4
Figure EV4. RIPK1 kinase and Nlrp3 do not drive arthritis development in Pggt1bΔ/Δ mice.
(A) Histological images of haematoxylin and eosin-stained knee joints of Pggt1b+/+, Pggt1bΔ/Δ, and Ripk1D138N/D138NPggt1bΔ/Δ mice. Representative pictures are shown. Scalebar, 200 µm. Arrows depict inflammation. (B) Histological scores for inflammation and exudate at the femur and tibia, each ranging from 0 (normal) to 3 (severely inflamed), of Pggt1b+/+ (n = 9), Pggt1bΔ/Δ (n = 5), and Ripk1D138N/D138NPggt1bΔ/Δ (n = 9) mice. (C) IL-18 cytokine levels in serum of Pggt1b+/+ (n = 9 biological replicates), Ripk1+/+Pggt1bΔ/Δ (n = 5) and Ripk1D138N/D138NPggt1bΔ/Δ (n = 5) mice. (D) Histological images of haematoxylin and eosin-stained knee joints of Pggt1b+/+, Pggt1bΔ/Δ, and Nlrp3−/−Pggt1bΔ/Δ mice. Representative pictures are shown. Scalebar, 200 µm. Arrows depict inflammation. (E) Histological scores for inflammation and exudate at the femur and tibia, each ranging from 0 (normal) to 3 (severely inflamed), of Pggt1b+/+ (n = 6), Pggt1bΔ/Δ (n = 7), and Nlrp3−/−Pggt1bΔ/Δ (n = 6) mice. (F) IL-18 cytokine levels in serum of Pggt1b+/+ (n = 7 biological replicates), Nlrp3+/+Pggt1bΔ/Δ (n = 4) and Nlrp3−/−Pggt1bΔ/Δ (n = 4). Data are expressed as mean ± s.e.m. Significance between groups was calculated by one-way ANOVA and Dunnett’s multiple comparison test. Source data are available online for this figure.
Figure EV5
Figure EV5. RAC1 but not RHOA activates the Pyrin inflammasome in Pggt1bΔ/Δ macrophages.
(A, B) Immunoblots showing levels of total RAC1 and RAC1-GTP (A), and total RHOA and RHOA-GTP (B) in LPS-stimulated BMDMs isolated from Pggt1b+/+ and Pggt1bΔ/Δ mice either treated or not with EHT1864 for 8 h. (C) Immunoblots showing levels of total RHOA and RHOA-GTP in lysates of Pggt1b+/+ and Pggt1bΔ/Δ BMDMs after treatment with LPS for 3 h. Actin was used as a loading control. Source data are available online for this figure.
Figure EV6
Figure EV6. Pggt1b deficiency does not regulate Pyrin phosphorylation levels directly.
(A) Immunoblots showing Pyrin and phospho (S205)-Pyrin levels in lysates of LPS-treated Pggt1b+/+, Pggt1bΔ/Δ and Mefv−/−Pggt1bΔ/Δ BMDMs. (B) Immunoblots showing Pyrin and phospho (S205)-Pyrin levels in lysates of LPS-treated Pggt1b+/+ and Pggt1bΔ/Δ BMDMs in the presence or absence of TcdB (0.5 µg/ml). Actin was used as a loading control. Source data are available online for this figure.
Figure EV7
Figure EV7. Summarizing model of Pyrin inflammasome activation in toxin-treated and Pggt1b-deficient macrophages.
(A) In untreated wildtype macrophages, geranylgeranyl pyrophosphate (GGPP)—a mevalonate pathway intermediate—facilitates the prenylation of RHO family GTPases, enabling their membrane localization and activation. Active RHO-GTP proteins engage effectors and activate kinases PKN1/2, which phosphorylate Pyrin and promote its binding to 14-3-3 proteins, thereby suppressing inflammasome activation. Bacterial toxins that inactivate RHO proteins prevent PKN1/2-mediated Pyrin phosphorylation, resulting in inflammasome assembly and IL-1β production. (B) In Pggt1b-deficient macrophages, impaired prenylation disrupts RHO protein membrane targeting and signaling. This leads to Pyrin inflammasome assembly with ASC and CASP1, cleavage of GSDMD and proIL-1β, and secretion of active IL-1β. Secreted IL-1β signals via the IL-1 receptor to upregulate Mefv transcription, thereby increasing Pyrin inflammasome activation. GTP guanine triphosphate, GDP guanine diphosphate, GEF guanine nucleotide exchange factors, GAP GTPases-activating proteins, TLR4 Toll-like receptor 4.

References

    1. Adachi O, Kawai T, Takeda K, Matsumoto M, Tsutsui H, Sakagami M, Nakanishi K, Akira S (1998) Targeted disruption of the MyD88 gene results in loss of IL-1- and IL-18-mediated function. Immunity 9:143–150 - PubMed
    1. Akula MK, Ibrahim MX, Ivarsson EG, Khan OM, Kumar IT, Erlandsson M, Karlsson C, Xu X, Brisslert M, Brakebusch C et al (2019) Protein prenylation restrains innate immunity by inhibiting Rac1 effector interactions. Nat Commun 10:3975 - PMC - PubMed
    1. Akula MK, Shi M, Jiang Z, Foster CE, Miao D, Li AS, Zhang X, Gavin RM, Forde SD, Germain G et al (2016) Control of the innate immune response by the mevalonate pathway. Nat Immunol 17:922–929 - PMC - PubMed
    1. An C, Sun F, Liu C, Huang SJ, Xu T, Zhang CX, Ge SL (2023) IQGAP1 promotes mitochondrial damage and activation of the mtDNA sensor cGAS-STING pathway to induce endothelial cell pyroptosis leading to atherosclerosis. Int Immunopharmacol 123:110795 - PubMed
    1. Briggs MW, Sacks DB (2003) IQGAP proteins are integral components of cytoskeletal regulation. EMBO Rep 4:571–574 - PMC - PubMed