. 2025 Aug 29;20(1):96.
doi: 10.1186/s13024-025-00883-4.

β-Amyloid induces microglial expression of GPC4 and APOE leading to increased neuronal tau pathology and toxicity

Affiliations

β-Amyloid induces microglial expression of GPC4 and APOE leading to increased neuronal tau pathology and toxicity

Brandon B Holmes et al. Mol Neurodegener. .

Abstract

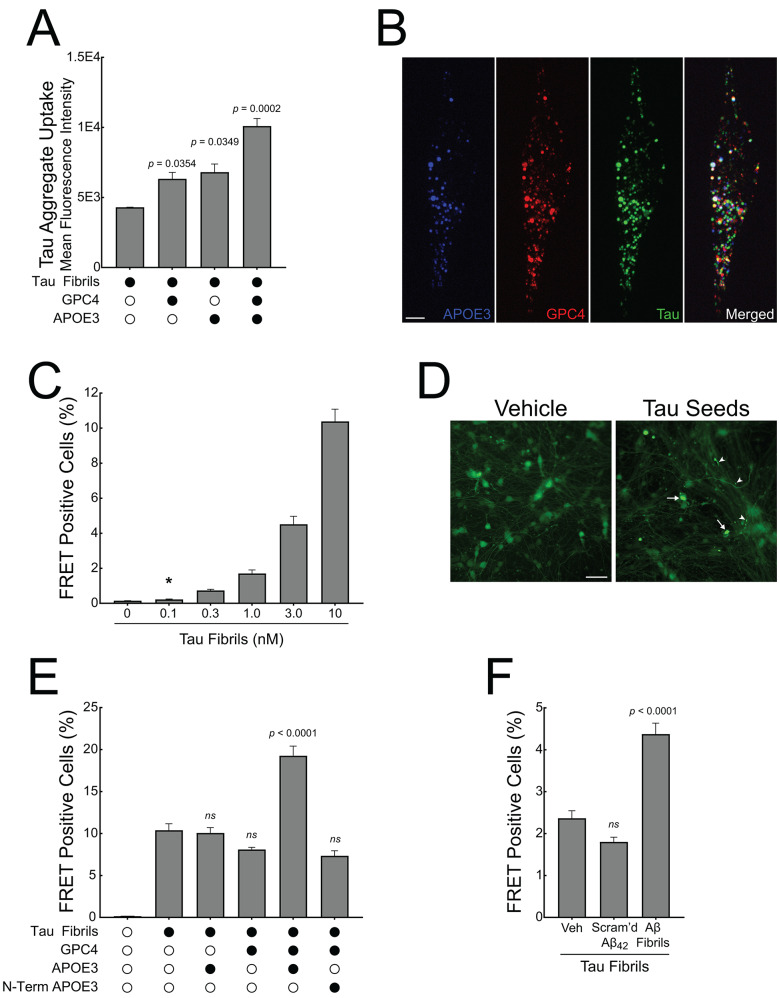
To define how Aβ pathology alters microglia function in Alzheimer’s disease, we profiled the microglia surfaceome following treatment with Aβ fibrils. Our findings reveal that Aβ-associated human microglia upregulate Glypican 4 (GPC4), a GPI-anchored heparan sulfate proteoglycan (HSPG). Glial GPC4 expression exacerbates motor deficits and reduces lifespan in a Drosophila amyloidosis model, implicating GPC4 in a toxic neurodegenerative program. In cell culture, GPC4 enhances microglia phagocytosis of tau aggregates, and shed GPC4 can act in trans to facilitate tau aggregate uptake and seeding in neurons. Additionally, our data demonstrate that GPC4-mediated effects are amplified in the presence of APOE. In human Alzheimer’s disease brain, microglial GPC4 expression surrounding Aβ plaques correlates with neuritic tau pathology, supporting a pathological link between amyloid, GPC4, and tau. These studies define a mechanistic pathway by which Aβ primes microglia to promote tau pathology via HSPGs and APOE.

Supplementary Information: The online version contains supplementary material available at 10.1186/s13024-025-00883-4.

Keywords: Drosophila model; APOE; Alzheimer’s disease; Amyloid; Astrocytes; GPC4; Heparan sulfate proteoglycans; Microglia; Neuroinflammation; Tau seeding.


Conflict of interest statement

Declarations. Ethics approval and consent to participate: All animal procedures were conducted in accordance with the guidelines set forth by the Institutional Animal Care and Use Committee at the University of Virginia School of Medicine, and study protocols were reviewed and approved prior to performing the experimental procedures described. Consent for publication: All authors have approved the contents of this manuscript and provided consent for publication. Competing interests: B.B.H has the following US patents: Therapeutic Anti-Tau Antibodies (US9834596), Method for Detection of Aggregates in Biological Samples (US9910048) and Methods and Compositions Related to Heparinoids (WO2021142312A1). M.K. is a co-scientific founder of Montara Therapeutics and serves on the Scientific Advisory Boards of Engine Biosciences, Casma Therapeutics, Alector, and Montara Therapeutics, and is an advisor to Modulo Bio and Recursion Therapeutics.

Figures

Fig. 1
Fig. 1
Surfaceomics of iTF Microglia reveal upregulation of glypicans. Volcano plots showing changes in surface proteins from iTF Microglia treated with (A) 1 µM Aβ40 fibrils, (B) 1 µM Aβ42 fibrils, or (C) 100 ng/mL LPS. The -log10 transformed p-value is plotted against the log2 transformed label-free quantitation ratios (log2 fold changes). N = 3–6 biological replicates. (D) Gene Set Enrichment Analysis of iTF Microglia treated with Aβ40 fibrils, Aβ42 fibrils, or LPS. The heatmap shows the normalized effect size of the top 25 most statistically altered pathways. Positive normalized effect size is shown in red (upregulation), and negative normalized effect size is shown in blue (downregulation). Gene Ontology terms highlighted in red font relate to glycosaminoglycan and proteoglycan biology. (E) Mass spectrometry label-free quantitation of cell surface heparan sulfate proteoglycans found in the surfaceomics experiments (A, B, C).
Fig. 2
Fig. 2
Amyloids induce iTF Microglial cell surface heparan sulfate and GPC4 expression. iTF Microglia treated with (A) Aβ40 and (B) Aβ42 fibrils have dose-dependent increases in cell surface heparan sulfate as measured by flow cytometry with 10E4 antibody. (C) Other inflammatory substrates and controls do not alter cell surface heparan sulfate levels. The statistical analyses were performed with a one-way ANOVA. N = 3 biological replicates. Heparan sulfate cell surface staining with 10E4 on (D) HEK293T cells, (E) iPSCs, (F) iNeurons, (G) iAstrocytes, and (H) BV2 cells treated with 1 µM Aβ40 and Aβ42 fibrils. The statistical analyses were performed with a one-way ANOVA and Holm-Sidak multiple comparisons tests for the adjusted p-values. N = 3 biological replicates. (I) GPC4 immunocytochemistry of iTF Microglia treated with 1 µM Aβ40 or Aβ42 fibrils. Scale bar = 10 μm. GPC4 flow cytometry quantification of (J) iTF Microglia or (K) iAstrocytes treated with 1 µM proteopathic amyloid fibrils. The statistical analyses were performed with a one-way ANOVA and Holm-Sidak multiple comparisons tests for the adjusted p-values. N = 3 biological replicates. In all graphs, the data represent the means ± SEM.
Fig. 3
Fig. 3
Microglial GPC4 expression is upregulated in human AD brain and correlates with amyloid pathology. (A) Representative confocal images of IBA1 (green), GPC4 (red), and DAPI (blue) in two age-matched controls and two AD cases. Scale bar = 20 μm. (B) GPC4 mean fluorescence intensity measurements in IBA1+ microglia from age-matched controls (N = 7) and AD (N = 4) cases. The statistical analysis was performed with a Student t-test for averaged values from individual subjects. The data represent the means ± SEM. (C) Representative confocal images of IBA1 (green), GPC4 (red), and Amylo-Glo (blue) in an AD case. Arrowhead = amyloid plaque; Arrow = GPC4+ microglia; Asterisk = GPC4 microglia. Scale bar = 40 μm. (D) Quantification of GPC4 mean intensity values in IBA+ microglia located at two distances from Amylo-Glo+ Aβ plaques. A total of eight plaques were measured from each brain, and for each plaque, microglia were binned into two separate categories, “near” or “far”, based on proximity to the plaque. Near: < 125 μm from center of plaque; Far: >150 μm and < 350 μm from edge of plaque. The p-values were determined by a paired t-test. The data represent the means ± SEM. (E) Scatter plots of microglial GPC4 mean fluorescence intensity per each patient versus their amyloid plaque burden, neurofibrillary tangle burden, or age. Pathological categories colored grey for control, purple for individuals for tau pathology only, blue for individuals with Aβ pathology only, or red for individuals with both tau and Aβ pathology. Normal distribution was assessed using the D’Agostino & Pearson test which indicated that GPC4 values, pathological burden values, and age were normally distributed. The p-values were determined by Pearson’s correlation with 95% confidence bands and adjusted for confounding by applying multiple linear regression.
Fig. 4
Fig. 4
Glial GPC4 worsens climbing and early lethality in an amyloid model of Drosophila. (A) Schematic model depicting Drosophila transgenic lines in which neurons express Aβ42 via the QUAS promoter and glia express dlp or dlp RNAi via the UAS promoter. Climbing heights were measured at day 1 post-eclosion (B) or day 5 post-eclosion (C) in Aβ42 flies expressing LacZ, dlp RNAi, or dlp cDNA. The numbers within the bars represent the number of flies measured per condition. The statistical analyses were performed with a Tobit regression with Bonferroni correction. (D) Median fly lifespans measured in days after eclosion (LacZ = 34 d; Aβ42 = 16 d; Aβ42 + dlp RNAi = 18 d; Aβ42 + dlp = 12 d). Lifespan data was analyzed using a Cox proportional hazard model with Bonferroni corrections. (LacZ n = 174; Aβ42n = 134; Aβ42 + dlp RNAi n = 56; Aβ42 + dlpn = 102). (E) Drosophila brains were immunostained for cleaved Dcp-1 and positive cells were counted across the entire brain. The statistical analysis was performed with a Student t-test. The error bars represent the SEM values.
Fig. 5
Fig. 5
Heparan sulfate and GPC4 mediate tau phagocytosis in iTF Microglia. Phagocytosis of pHrodo red-labeled tau fibrils after pretreatment with Aβ40 (A) or Aβ42 (B) fibrils by iTF Microglia. Phagocytosis of pHrodo red-labeled tau fibrils in the presence of heparan sulfate proteoglycan inhibitors heparin (100 µg/mL) or chlorate (25 mM) after pretreatment with Aβ40 (C) or Aβ42 (D) fibrils. The statistical analysis for experiments A–D were performed with a one-way ANOVA and Holm-Sidak multiple comparisons test. N = 4. Phagocytosis of pHrodo red-labeled tau fibrils using inducible CRISPRi (E) or inducible CRISPRa (F) iTF Microglia transduced with GPC4 sgRNAs. The CRISPRa and CRISPRi elements are activated by trimethoprim (50 nM). The statistical analyses for experiments E, F were performed with a paired t-test. N = 4. (G) Flow cytometry analysis of iTF Microglia measures the abundance of cell surface GPC4, normalized to total GPC4 levels, after treatment with α-GPC4 sdAb-Fc or isotype control antibodies for 24 h. (H) Flow cytometry analysis of AF647-labeled tau fibrils binding to the iTF Microglia cell surface after pre-treatment with an α-GPC4 antibody. The cell surface binding experiment was performed at 4 °C. The statistical analyses were performed with a Student t-test. The data represent the means ± SEM.
Fig. 6
Fig. 6
β-Amyloid fibrils lead to GPC4 shedding and APOE secretion which promote tau phagocytosis. (A) GPC4 WT, GPC4-ΔHS, GPC4-sec, or NLuc control plasmids were transiently transfected into HEK293T cells and tau aggregate-AF647 uptake was measured via flow cytometry. (B) Schematic model depicting NLuc-GPC4 fusion protein for tracking GPC4 shedding into the conditioned media via luminescence. (C) NLuc-GPC4 luminescence was measured in iTF Microglia conditioned media after a 24 h treatment with Aβ40 and Aβ42 fibrils. pHrodo-red labeled tau aggregates (50 nM) were preincubated with (D) soluble recombinant GPC4 or (E) soluble recombinant APOE3 and uptake was measured every hour for 48 h with an Incucyte SX5 in iTF Microglia. (F) pHrodo-red labeled tau aggregates (50 nM) were preincubated with soluble recombinant GPC4 alone, APOE3 alone, or GPC4 + APOE3 (250 nM) and uptake was measured every hour for 48 h in iTF Microglia. The statistical analyses were performed with a one-way ANOVA and Holm-Sidak multiple comparisons test. N = 4. The data represent the means ± SEM.
Fig. 7
Fig. 7
GPC4 and APOE3 amplify tau seeding in iNeuron FRET biosensors. (A) Uptake of tau-pHrodo red fibrils (50 nM) with or without GPC4 or APOE3 (250 nM) measured at 16 h in SH-SY5Y cells. (B) SH-SY5Y cells were co-incubated with tau-647 fibrils, GPC4-546 or APOE3-488 for 16 h, trypsinized, replated, and then imaged on a confocal microscope 4 h later. Scale bar = 10 μm. (C) iNeuron tau FRET biosensors were treated with varying doses of full-length tau fibrils for 7 days prior to measuring intraneuronal tau pathology by FRET flow cytometry. The assay is linear and statistical significance is first reached at a tau fibril concentration of 0.1 nM. (D) Confocal images of iNeuron tau FRET biosensors treated with vehicle or 10 nM tau fibrils for 7 days. The arrows mark tau aggregates within the neuron soma and the arrowheads mark tau aggregates within neuron processes. Scale bar = 40 µm. (E) iNeuron tau FRET biosensors were treated with tau fibrils (10 nM) with or without GPC4, APOE3, or N-terminal APOE3 (50 nM) for seven days prior to FRET flow cytometry. (F) iNeuron tau FRET biosensors were treated with Aβ40/42-primed microglia conditioned media containing 10 nM tau fibrils for 7 days prior to FRET flow cytometry. The statistical analyses were performed with a one-way ANOVA and Holm-Sidak multiple comparisons test. N = 4. The data represent the means ± SEM.
Fig. 8
Fig. 8
Peri-plaque GPC4 correlates with neuritic tau pathology. (A) Aβ fibrils stimulate microglia to upregulate GPC4 on their cell surface. In response to Aβ, GPC4 is proteolytically shed into the extracellular space, releasing a soluble proteoform. Concurrently, Aβ-exposed microglia secrete APOE, which interacts with GPC4 and tau to form a tripartite complex. This complex potentiates tau neuronal uptake and pathological seeding, ultimately contributing to the spread of tau pathology. (B) Representative confocal images of GPC4 (red) and amyloid plaques (blue) and tau pathology (green) using the BF-188 dye in AD brain tissue. Three representative plaques with varying degrees of GPC4 are depicted. Scale bar = 20 μm. (C) Scatter plot showing a positive correlation between GPC4 and tau pathology within individual amyloid plaques among four AD cases. N = 215 plaques. The p-value was determined by Pearson’s correlation with 95% confidence bands.

Update of

References

    1. Braak H, Alafuzoff I, Arzberger T, Kretzschmar H, Del Tredici K. Staging of alzheimer disease-associated neurofibrillary pathology using paraffin sections and immunocytochemistry. Acta Neuropathol. 2006;112(4):389–404. - PMC - PubMed
    1. Musiek ES, Holtzman DM. Origins of alzheimer’s disease: reconciling cerebrospinal fluid biomarker and neuropathology data regarding the Temporal sequence of amyloid-beta and Tau involvement. Curr Opin Neurol. 2012;Publish Ahead of Print:10.1097/WCO.0b013e32835a30f4 - PMC - PubMed
    1. Götz J, Chen F, van Dorpe J, Nitsch RM. Formation of neurofibrillary tangles in P301L Tau Transgenic mice induced by Aβ42 fibrils. Science. 2001;293(5534):1491–5. - PubMed
    1. Lewis J, Dickson DW, Lin WL, Chisholm L, Corral A, Jones G, et al. Enhanced neurofibrillary degeneration in Transgenic mice expressing mutant Tau and APP. Science. 2001;293(5534):1487–91. - PubMed
    1. Hurtado DE, Molina-Porcel L, Iba M, Aboagye AK, Paul SM, Trojanowski JQ, et al. A{beta} accelerates the Spatiotemporal progression of Tau pathology and augments Tau amyloidosis in an alzheimer mouse model. Am J Pathol. 2010;177(4):1977–88. - PMC - PubMed

LinkOut - more resources