. 2025 Aug 29;12(1):54.
doi: 10.1186/s40779-025-00637-9.

Clinical-transcriptomic classification of lumbar disc degeneration enhanced by machine learning

Affiliations

Clinical-transcriptomic classification of lumbar disc degeneration enhanced by machine learning

Huai-Jian Jin et al. Mil Med Res. .

Abstract

Background: Lumbar disc degeneration (LDD) displays considerable heterogeneity in terms of clinical features and pathological changes. However, researchers have not clearly determined whether the transcriptome variations in LDD could be used to identify or interpret the causes of heterogeneity in clinical features. This study aimed to identify the transcriptomic classification of degenerated discs in LDD patients and whether the molecular subtypes of LDD could be accurately predicted using clinical features.

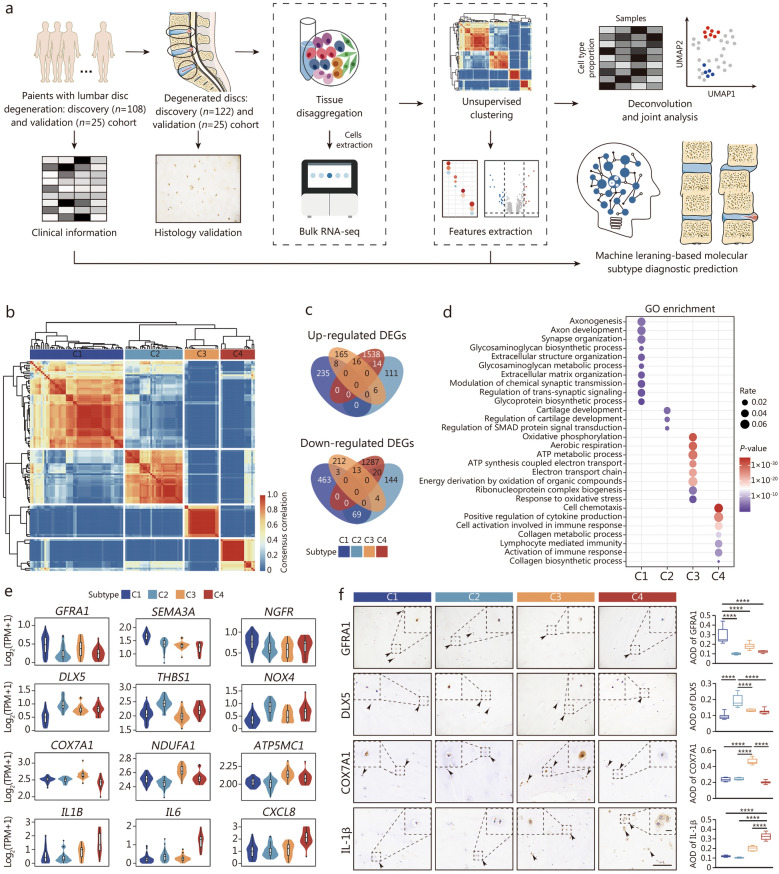
Methods: One hundred and twenty-two nucleus pulposus (NP) tissues from 108 patients were consecutively collected for bulk RNA sequencing (RNA-seq). An unsupervised clustering method was employed to analyze the bulk RNA matrix. Differential analysis was performed to characterize the transcriptional signatures and subtype-specific extracellular matrix (ECM) dysregulation. The cell subpopulation states of each subtype were inferred by integrating bulk and single-cell sequencing datasets. Transwell and dual-luciferase reporter gene assays were employed to investigate possible molecular mechanisms involved. Machine learning algorithm diagnostic prediction models were developed to correlate molecular classification with clinical features.

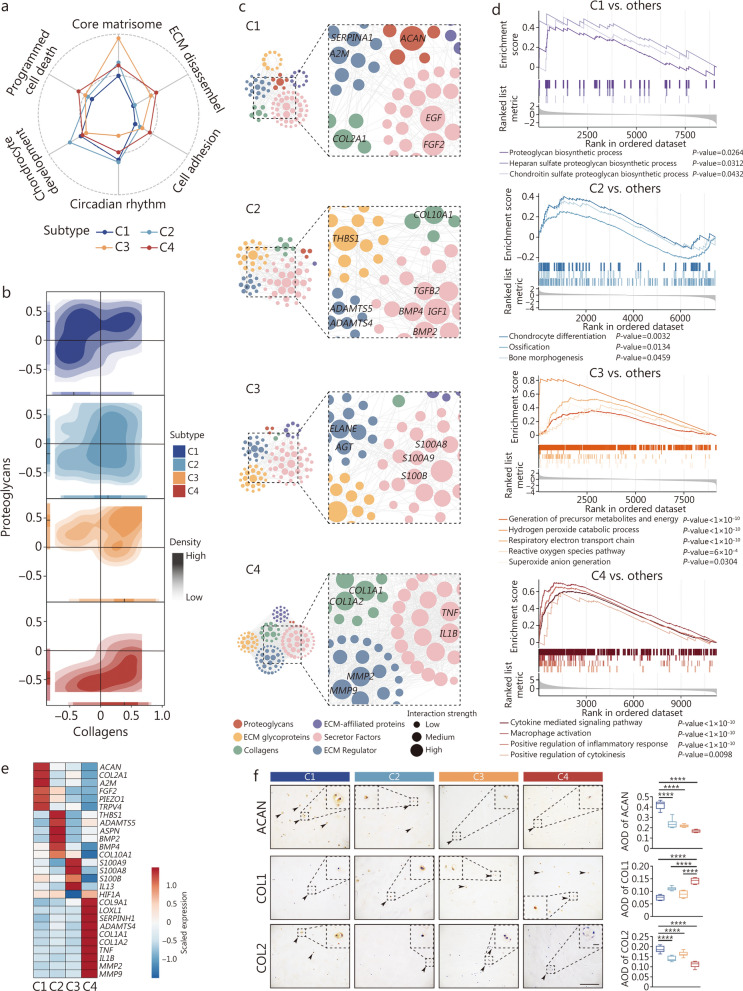
Results: LDD was classified into 4 subtypes with distinct molecular signatures and ECM remodeling: C1 with collagenesis, C2 with ossification, C3 with low chondrogenesis, and C4 with fibrogenesis. Chond1-3 in C1 dominated disc collagenesis via the activation of the mechanosensors TRPV4 and PIEZO1; NP progenitor cells in C2 exhibited chondrogenic and osteogenic phenotypes; Chond1 in C3 was linked to a disrupted hypoxic microenvironment leading to reduced chondrogenesis; Macrophages in C4 played a crucial role in disc fibrogenesis via the secretion of tumor necrosis factor-α (TNF-α). Furthermore, the random forest diagnostic prediction model was proven to have a robust performance [area under the receiver operating characteristic (ROC) curve: 0.9312; accuracy: 0.84] in stratifying the molecular subtypes of LDD based on 12 clinical features.

Conclusions: Our study delineates 4 distinct molecular subtypes of LDD that can be accurately stratified on the basis of clinical features. The identification of these subtypes would facilitate precise diagnostics and guide the development of personalized treatment strategies for LDD.

Keywords: Diagnosis; Lumbar disc degeneration (LDD); Machine learning; Molecular classification; RNA sequencing (RNA-seq); Transcriptome.


Conflict of interest statement

Declarations. Ethics approval and consent to participate: This study was performed in accordance to the Declaration of Helsinki and was approved by the Ethics Committee of the Army Medical Center of PLA (2022-312). The information of all patients was deidentified to protect patient privacy. Written informed consent for this study was obtained from all participants. This study was registered in the Chinese Clinical Trial Registry at https://www.chictr.org.cn (ChiCTR2200066854). Consent for publication: Not applicable. Competing interests: All the authors declare that they have no competing interests and that no generative AI or AI-assisted technology was employed in the writing process. The Army Medical Center of PLA supported this submission.

Figures

Fig. 1
Fig. 1
Identification and validation of transcriptome-based LDD subtypes. a Study scheme overview. Description of patient recruitment, IVD sample collection, RNA extraction and sequencing, and the computational analysis strategy. b Heatmap visualization of genes across 122 NP samples revealing four distinct subtypes (C1–C4). c Venn diagram showing upregulated DEGs per subtype. d GO analysis showing the enriched biological processes of each subtype. e Violin plots showing the expression of representative genes across subtypes. f Representative immunohistochemical analysis of the specific selected proteins in NP tissues by subtype. Scale bar = 100 μm, insert panel = 10 μm. ****P < 0.0001. AOD average optical density, C1 cluster 1, C2 cluster 2, C3 cluster 3, C4 cluster 4, DEGs differentially expressed genes, GO Gene Ontology, IVD intervertebral disc degeneration, LDD lumbar disc degeneration, NP nucleus pulposus
Fig. 2
Fig. 2
Delineating subtype-specific matrisome dysregulation traits. a Radar map showing the performance of 6 gene sets associated with LDD. b Contour map showing scores of the core ECM collagens and proteoglycans. c Regulatory network of upregulated DEMGs. Nodes represent upregulated DEMGs. The edge between 2 nodes represents a potential interaction. Red indicates proteoglycans, green indicates collagens, yellow indicates ECM glycoproteins, purple indicates ECM-affiliated proteins, pink indicates secreted factors, and blue indicates ECM regulators. d Enrichment plots of the ECM-associated gene set. The line chart indicates differences between subtypes in the individual ECM-associated gene set. e Heatmap showing representative subtype-specific DEMGs. f Representative immunohistochemical analysis of the core matrisome proteins, including ACAN, collagen I (COL1), and collagen II (COL2). Scale bar = 100 μm, insert panel = 10 μm. **P < 0.01, ****P < 0.0001. ACAN agrrecan, AOD average optical density, C1 Cluster 1, C2 Cluster 2, C3 Cluster 3, C4 Cluster 4, COL1A1 collagen type I alpha 1 chain, COL2A1 collagen type II alpha 1 chain, DEMGs differentially expressed matrisome genes, ECM extracellular matrix, LDD lumbar disc degeneration
Fig. 3
Fig. 3
Deconvolution analysis revealing the cell subpopulations in each subtype. a The integration scheme of the scRNA-seq data and the deconvolution scheme of the scRNA-seq and bulk RNA-seq data with BayesPrism and Scissor. b UMAP visualization displaying the cell subpopulations in the integrated scRNA-seq dataset. c Bar chart showing the cell subpopulation proportions per subtype using BayesPrism. d UMAP visualization of the Scissor selected cells of the C4 subtype. The red and blue dots represent cells associated with the C4 and non-C4 subtypes, respectively. e Bar chart showing the cell subpopulation composition of the C4 subtype. f Violin plots showing the expression levels of IL1β and TNF in each cell subpopulation. Circos plot showing the TNF signaling pathway network (g) and the CXCL signaling pathway network (h) between cell subpopulations. C1 cluster 1, C2 cluster 2, C3 cluster 3, C4 cluster 4, CXCL C-X-C motif chemokine ligand, EC endothelial cells, GMPs granulocyte monocyte progenitors, NP nucleus pulposus, NPPC nucleus pulposus progenitor cell, TNF tumor necrosis factor, UMAP uniform manifold approximation and projection
Fig. 4
Fig. 4
Comprehensive analysis of the machine learning-based diagnostic prediction model. a Heatmap representing the clinical features grouped according to the proposed LDD molecular subtypes. ROC curves and AUROCs (b), PR curves and APs (c) derived from the training and testing sets in the discovery cohort. d Beeswarm visualizing attributes of the 12 most important features of the random forest predictive model in SHAP. Each line represents a feature, and the abscissa is the SHAP value. Red dots represent higher eigenvalues, and blue dots represent lower eigenvalues. Confusion matrix (e) and ROC curve (f) for testing the accuracy and AUROC of the selected RF model in the validation cohort. AP area under the PR curve, AUROC area under the ROC curve, BMI body mass index, C1 cluster 1, C2 cluster 2, C3 cluster 3, C4 cluster 4, IDH intervertebral disc height, LDD lumbar disc degeneration, MLR multinomial logistic regression, NC neurogenic claudication, NNet neural network, NRS numerical rating scale, PR precision‒recall, RF random forest, ROC receiver operating characteristic, SHAP Shapley additive explanation, SLR straight-leg-raising, SVM support vector machine
Fig. 5
Fig. 5
NPC‒M1 macrophage interactions contribute to NPC fibrotic phenotype ex vivo, and TNF-α influences COL1A1 expression in INPCs via the transcription factor NF-κB1 (p50) in vitro. a Scheme of RF-based LDD subtype prediction, flow cytometry analysis of CD235aCD31CD68+ cells and CD235aCD31CD68CD45 NPC sorting, and transwell coculture of NPCs and M1 macrophages differentiated from THP-1 monocyte lines. b Representative flow cytometry isolation of CD235aCD31CD68+ cells from NP tissues. c Representative immunofluorescence analysis of selected core ECM protein (ACAN, collagen I (COL1), and collagen II (COL2)) via a transwell assay. Scale bar = 100 μm. d Violin plots showing significant upregulation of NFKB1 in C4. e Pearson correlation analysis of COL1A1 with NF-κB1 in the bulk RNA-seq dataset. f Immunoblot and densitometry plots (n = 3) of COL1A1 in INPCs after treatment with TNF-α (10 ng/ml) or JSH-23 (10 μmol/L) for 24 h. Immunoblots showing the time-dependent expression of IκBα and p-IkBα in the cytosolic extracts (g) and NF-κB1 (p50) in the nuclear extracts (h) of INPCs treated with TNF-α (10 ng/ml) for 24 h. i Immunofluorescence analysis of INPCs treated with TNF-α (10 ng/ml) for 30 min and stained for p50 (green) and nuclei (blue). The arrows show the nuclear localization of p50. Scale bar = 50 μm. j Fluorescence activity in 293T cells with wild-type and mutant COL1A1 promotors with pcDNA3.1-NFKB1. k Schematic graph showing that TNF-α-induced p50 activation enhances COL1A1 expression. *P < 0.05, **P < 0.01, ***P < 0.001, ****P < 0.0001. ACAN aggrecan, C1 cluster 1, C2 cluster 2, C3 cluster 3, C4 cluster 4, COL1A1 collagen type I alpha 1 chain, ECM extracellular matrix, ETA etanercept, FASC fluorescence-activated cell sorting, INPCs immortalized NP cells, LDD lumbar disc degeneration, MUT mutant, NF-κB1 nuclear factor kappa B subunit 1, NP nucleus pulposus, NPC nucleus pulposus cell, RF random forest, SHAP Shapley additive explanation, TBP TATA binding protein, TNF-α tumor necrosis factor-α, WT wide-type

References

    1. Battié MC, Videman T. Lumbar disc degeneration: epidemiology and genetics. J Bone Joint Surg Am. 2006;88(Suppl 2):3–9. - PubMed
    1. GBD 2021 Low Back Pain Collaborators. Global, regional, and national burden of low back pain, 1990-2020, its attributable risk factors, and projections to 2050: a systematic analysis of the Global Burden of Disease Study 2021. Lancet Rheumatol. 2023;5(6):e316–29. - PMC - PubMed
    1. Deyo RA, Mirza SK. Clinical practice herniated lumbar intervertebral disk. N Engl J Med. 2016;374(18):1763–72. - PubMed
    1. Schneiderman G, Flannigan B, Kingston S, Thomas J, Dillin WH, Watkins RG. Magnetic resonance imaging in the diagnosis of disc degeneration: correlation with discography. Spine. 1987;12(3):276–81. - PubMed
    1. Thompson JP, Pearce RH, Schechter MT, Adams ME, Tsang IK, Bishop PB. Preliminary evaluation of a scheme for grading the gross morphology of the human intervertebral disc. Spine. 1990;15(5):411–5. - PubMed

LinkOut - more resources