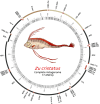
The first complete mitochondrial genome of Zu cristatus (Bonelli, 1819) sheds new light on its phylogenetic position and molecular evolution
- PMID: 40883856
- PMCID: PMC12395869
- DOI: 10.1186/s40850-025-00238-y
The first complete mitochondrial genome of Zu cristatus (Bonelli, 1819) sheds new light on its phylogenetic position and molecular evolution
Abstract
Background: Fishes are key components of the megafauna of the deep sea, and evolutionary adaptations to deep-sea life appear to have occurred independently in at least 22 fish orders. In this context, the analysis of even more fish genomes and mitogenomes has fundamental importance, providing a valuable resource for understanding the molecular mechanisms underlying evolutionary adaptation, especially to extreme environments such as the deep sea. Here, we report the first complete mitochondrial genome of Zu cristatus (Bonelli, 1819), providing essential information on its structure and phylogeny.
Results: After sequencing on the Illumina HiSeq 4000 platform, processing, and assembly via MitoFinder software v.1.4.1, a single circular mtDNA molecule of 17,450 bp in length was annotated. A total of 37 genes were identified, including the first D-loop region for this species. The asymmetry for both AT skews and GC skews is negative, and the AT content is 56.4%. We also detected the presence of 15 small, noncoding, intergenic nucleotide (IGN) regions and some rare stop codons in bony fishes. Pairwise distance and phylogenetic analyses against a list of other mitochondrial sequences from 42 bony fishes confirmed the current phylogeny with previously related orders. EasycodeML analysis revealed that only 4 PCGs underwent positive selection. New questions about the phylogeny of Lampriformes emerged from our phylogenetic analyses of Lampriformes COI.
Conclusion: Overall, the findings of this study highlight the need to elucidate the genetic features of bony fishes in relation to their deep-sea adaptation, with a focus on rare and interesting species.
Keywords: Deep-sea environment; Genome sequencing; Lampriformes; Marine genomics; Marine zoology; Scalloped ribbonfish.
© 2025. The Author(s).
Conflict of interest statement
Declarations. Ethics approval and consent to participate: Not applicable. The specimen analyzed in this manuscript represents the bycatch of commercial fishery, which comes from fishing waste that was not originally fished for scientific purposes. Fish specimen was obtained already dead. No experiments were conducted, nor were surgical procedures performed. No procedures caused lasting harm to sentient fish, nor were sentient fish subjected to chemical agents. The care and use of collected animals complimented with animal welfare guidelines, laws, and regulations set by the Italian Government. Consent for publication: Not applicable. Competing interests: The authors declare no competing interests.
Figures


Similar articles
-
Prescription of Controlled Substances: Benefits and Risks.2025 Jul 6. In: StatPearls [Internet]. Treasure Island (FL): StatPearls Publishing; 2025 Jan–. 2025 Jul 6. In: StatPearls [Internet]. Treasure Island (FL): StatPearls Publishing; 2025 Jan–. PMID: 30726003 Free Books & Documents.
-
The quantity, quality and findings of network meta-analyses evaluating the effectiveness of GLP-1 RAs for weight loss: a scoping review.Health Technol Assess. 2025 Jun 25:1-73. doi: 10.3310/SKHT8119. Online ahead of print. Health Technol Assess. 2025. PMID: 40580049 Free PMC article.
-
A rapid and systematic review of the clinical effectiveness and cost-effectiveness of paclitaxel, docetaxel, gemcitabine and vinorelbine in non-small-cell lung cancer.Health Technol Assess. 2001;5(32):1-195. doi: 10.3310/hta5320. Health Technol Assess. 2001. PMID: 12065068
-
Short-Term Memory Impairment.2024 Jun 8. In: StatPearls [Internet]. Treasure Island (FL): StatPearls Publishing; 2025 Jan–. 2024 Jun 8. In: StatPearls [Internet]. Treasure Island (FL): StatPearls Publishing; 2025 Jan–. PMID: 31424720 Free Books & Documents.
-
Signs and symptoms to determine if a patient presenting in primary care or hospital outpatient settings has COVID-19.Cochrane Database Syst Rev. 2022 May 20;5(5):CD013665. doi: 10.1002/14651858.CD013665.pub3. Cochrane Database Syst Rev. 2022. PMID: 35593186 Free PMC article.
References
-
- Tiralongo F, Crocetta F, Riginella E, Lillo AO, Tondo E, Macali A, et al. Snapshot of rare, exotic and overlooked fish species in the Italian seas: A citizen science survey. J Sea Res. 2020;164:101930.
-
- DULCIC J, JARDAS I. New record of Opah Lampris guttatus (Lampridae) in the Adriatic waters with a review of Adriatic records. Cybium. 2005;29:195–7.
-
- Orsi Relini L, Lanteri L, Garibaldi F. Medusivorous fishes of the mediterranean. A coastal safety system against jellyfish blooms. Biol Mar Mediterr. 2010;17:348–9.
-
- Wallach AD, Ripple WJ, Carroll SP. Novel trophic cascades: apex predators enable coexistence. Trends Ecol Evol. 2015;30:146–53. - PubMed
-
- Strona G, Palomares MLD, Bailly N, Galli P, Lafferty KD. Host range, host ecology, and distribution of more than 11 800 fish parasite species. Ecology. 2013;94:544–544.
LinkOut - more resources
Full Text Sources
Miscellaneous

