. 2025 Aug 27;53(16):gkaf827.
doi: 10.1093/nar/gkaf827.

G-quadruplex-dependent transcriptional regulation by molecular condensation in the Bcl3 promoter

Affiliations

G-quadruplex-dependent transcriptional regulation by molecular condensation in the Bcl3 promoter

Wanki Yoo et al. Nucleic Acids Res. .

Abstract

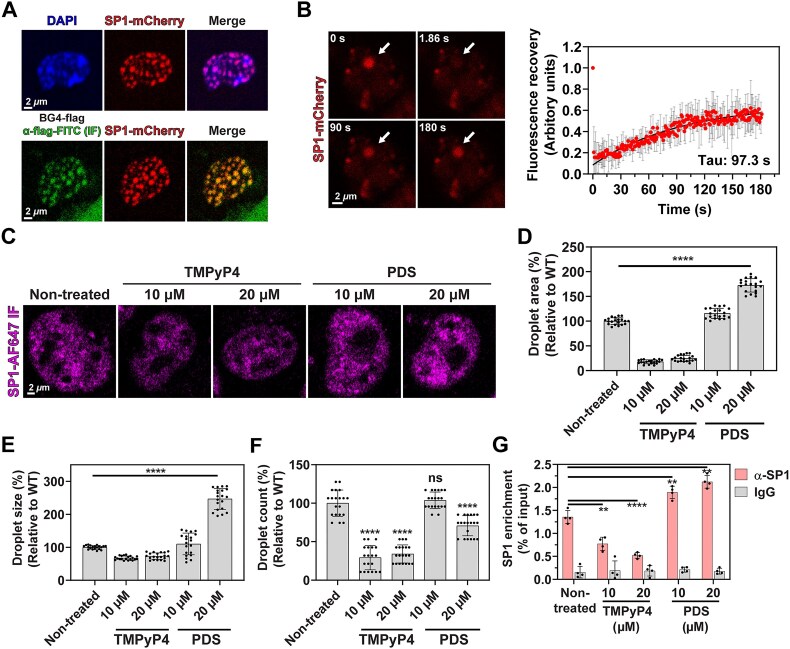
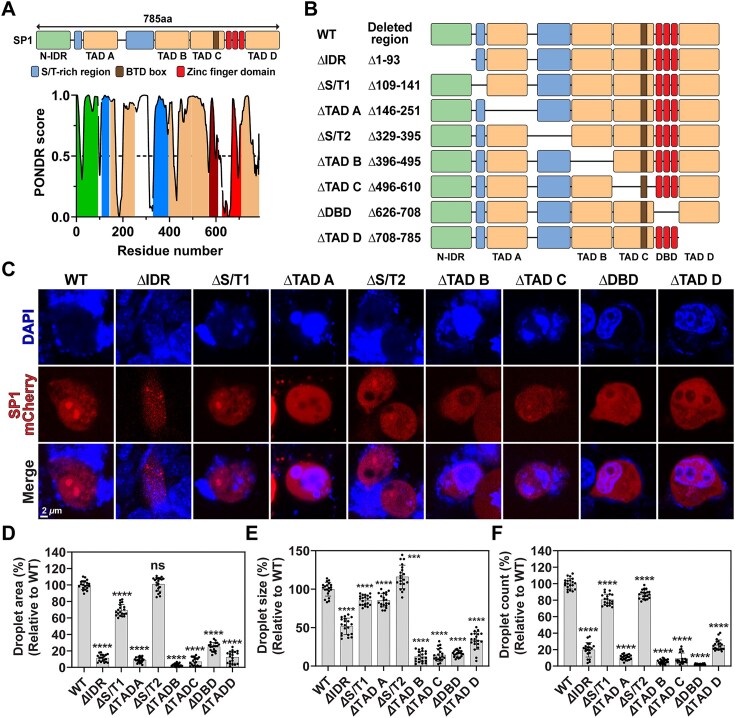
G-quadruplexes (G4s) are pivotal in transcriptional regulation. Although the interaction between G4s and G4-binding transcription factors (TFs) is critical for G4-dependent transcriptional regulation, the detailed mechanism, especially TF enrichment at G4s and its correlation with transcriptional regulation, remains unknown. In this study, using specificity protein 1 (SP1) as a representative G4-binding TF, we examined the mechanism of G4-dependent transcriptional regulation. Genomic analysis revealed substantial enrichment of SP1 in the oncogenic Bcl3 promoter harboring G4-forming sequences. We demonstrated that the formation of transcriptional condensates and the transcriptional activation of the Bcl3 promoter are heavily dependent on G4-dependent SP1 binding. Moreover, dissociation of SP1 condensates was prompted by RNA, which was enhanced by G4 formation within the RNA. Collectively, these results underscore the pivotal role of G4 in regulating gene expression through the modulation of SP1-mediated transcriptional condensation.


Conflict of interest statement

The authors declare no competing financial interest.

Figures

Graphical Abstract
Graphical Abstract
Figure 1.
Figure 1.
The Bcl3 promoter is SP1-enriched promoter and contains G-quadruplex (G4)-forming sequence. (A) A plot showing the distribution of SP1 ChIP followed by sequencing (ChIP-seq) reads (raw counts) across 46 447 gene promoters, ranked in ascending order. Both axes were scaled from 0 to 1. A geometric threshold value of 9.94 was determined, corresponding to a slope of 1.0 for the tangent line in the scaled plot. SP1 binding density for each promoter was defined as the proportion of SP1 ChIP-seq reads above this threshold relative to the total number of such reads. (B) A ranked plot of SP1 binding density for 545 promoters. Both axes were scaled from 0 to 1. Promoters lying above the line with a slope of 1 (tangent to the plot) were designated as SP1-enriched. (C) Genome browser (IGV) tracks showing ChIP-seq profiles of SP1, MED1, and RNA Polymerase II, as well as RNA-seq data around the Bcl3 locus in MCF-7 cells. The promoter region spanning from −1000 to + 500 bp relative to the TSS is marked with a yellow bar. (D) Schematic representation of the G4-forming region within the Bcl3 promoter and its nucleotide sequence. (E) CD spectra of oligonucleotides from the Bcl3 promoter annealed in the presence of 100 mM KCl, NaCl, or LiCl. (F-H) CD analysis of WT and mutant (MT) oligonucleotides, including G6A, G6/8A, GI/IVA, and a negative control (NC). (F) Sequences of WT and MT oligos. The putative SP1 binding site and guanines involved in G4 formation are highlighted. (G) CD spectra of WT and MT oligos annealed in the presence (solid lines) or absence (dashed lines) of KCl. (H) Thermal melting analysis of WT and MT oligos annealed in 100 mM KCl, recorded from 25°C to 95°C. (I) Luciferase reporter assay using pGL4.11 plasmids containing WT or MT Bcl3 promoter sequences transfected into MDA-MB-231 cells. Luciferase activity was normalized to co-transfected Renilla luciferase from pRL-TK and presented relative to the WT promoter. Data represent the mean ± SD of at least three independent experiments. .
Figure 2.
Figure 2.
G4 facilitates the binding of SP1 to DNA and the condensation of SP1 with DNA. (A) EMSA of SP1 binding to WT, GI/IVA, PCNG4, and negative control (NC) oligonucleotides. Increasing concentrations of SP1 were incubated with each oligo and resolved on a 5% polyacrylamide gel. Bands migrating more slowly than free oligo were interpreted as SP1-bound DNA complexes. (B) Quantification of binding fractions for each oligo across varying SP1 concentrations, derived from the EMSA in (A). Binding fraction was calculated using the formula: 1 – (free DNA intensity / free DNA intensity at 0 nM SP1). Data represent mean ± standard deviation from three independent experiments. (C) Apparent dissociation constant (KD), Hill coefficient and Bmax values were obtained by fitting the binding curves in (B) to the Hill equation using nonlinear regression in GraphPad Prism. (D) Phase separation of SP1-Cy3 with or without double-stranded Bcl3 G4 oligo (dsBcl3). Condensates were visualized by differential interference contrast (DIC) and fluorescence (FS) microscopy. (E) Phase diagram indicating condensate formation across varying concentrations of SP1 and dsBcl3. Filled and open circles represent conditions that did or did not produce condensates, respectively. Condensate formation was defined by a mean FS intensity > 0.3, as quantified using ImageJ. (F) Representative FS images of SP1-Cy3/dsBcl3 G4 droplets showing fusion events, indicating liquid-like behavior in vitro. (G) FRAP analysis of SP1-Cy3/dsBcl3 G4 condensates. Bleaching was initiated at 0 s. The recovery curve shows the mean and standard deviation of Cy3 intensity across 15 droplets. Data were fitted to a double exponential function. (H) FS images of SP1-Cy3 condensates formed at varying SP1:dsBcl3-Cy5 ratios. dsBcl3-Cy5 was pre-annealed in the presence or absence of KCl. (I) Quantification of total condensate area relative to that at an SP1:DNA ratio of 1:0.1 (with KCl). Data represent the mean ± standard deviation from ten randomly selected fields of view. The graphs show the mean and standard deviation of ten randomly chosen regions. Experiments were performed independently twice.
Figure 3.
Figure 3.
G4 ligands modulate SP1 condensation in cells. (A) Representative FS images of MDA-MB-231 cells expressing SP1-mCherry (top) and immunofluorescence (IF) images of cells stained with FITC-labeled BG4 antibody (bottom), which recognizes G4 structures. Images were captured at 40× magnification. Enlarged views of single cells are shown. (B) FRAP analysis of SP1-mCherry condensates. Photobleaching was initiated at 0 s. The recovery curve shows the mean and standard deviation of mCherry intensity across 15 condensates. The curve was fitted using a double exponential function. (C-F) IF analysis of endogenous SP1 using Alexa Fluor 647-conjugated anti-SP1 antibody in MDA-MB-231 cells treated with TMPyP4 or PDS at 10 or 20 μM. (D) Quantification of total condensate area, (E) average droplet size, and (F) droplet count, each shown relative to the untreated control. Data represent the mean ± standard deviation from ten randomly selected regions. Experiments were independently performed twice. (G) ChIP followed by quantitative PCR (ChIP-qPCR) analysis of SP1 binding at the Bcl3 promoter in MDA-MB-231 cells treated with TMPyP4 or PDS. An anti-SP1 antibody was used for immunoprecipitation, and normal IgG served as a negative control. Values are normalized to 5% input. Data represent mean ± standard deviation from at least three independent experiments.
Figure 4.
Figure 4.
G4-dependent SP1 condensation enhances transcription. (A) Schematic of the pGL4.11-Bcl3-12 × PP7 reporter plasmid (left) and the PP7–PCP system used to visualize nascent transcripts in living cells (right). (B) FS images of MDA-MB-231 cells transfected with SP1-mCherry alone (without reporter plasmid; w/o pGL4.11) or co-transfected with the pGL4.11-Bcl3-12 × PP7 reporter plasmid (with reporter; w pGL4.11). Top panels show 40 × magnification images; bottom panels display close-up images of individual cells. (C) Representative FS images of MDA-MB-231 cells co-transfected with SP1-mCherry, PCP-CFP, and the reporter plasmid. Top: 40 × magnification images; bottom: enlarged views of single cells. (D) Schematic of reporter plasmid constructs containing WT, G6/8A, or GI/IVA mutant Bcl3 promoter sequences (top). Representative FS images of MDA-MB-231 cells co-transfected with SP1-mCherry, PCP-CFP, and the respective reporter plasmid (bottom). Images were acquired at 40 × magnification, and single-cell close-ups are shown. (E) Quantification of total PCP-CFP condensate area, normalized to the signal from cells transfected with the WT reporter construct. Graphs represent the mean ± standard deviation from ten randomly selected fields. Experiments were independently repeated twice. (F, G) Colocalization of SP1 with transcriptional coactivators in MDA-MB-231 cells. (F) IF of SP1-AF647 in cells expressing MED1-IDR-YFP. Line profile analysis of fluorescence intensity along the indicated black dashed line is shown on the right. (G) Dual IF of SP1-AF647 (magenta) and RNA Polymerase II-AF488. Line profile along the yellow dashed line shows spatial overlap of fluorescence signals (right).
Figure 5.
Figure 5.
TADs and DBD of SP1 are crucial for SP1 condensation. (A) Schematic representation of the full-length human SP1 protein (UniProt ID: P08047) (top) and the intrinsic disorder prediction across the amino acid sequence, as determined by PONDR (Predictor of Natural Disordered Regions) software (bottom). (B) Schematic diagrams of WT and domain-deletion mutants (MTs) of SP1. The deleted regions in each mutant construct are indicated by amino acid residue numbers. (C–F) Representative FS images of MDA-MB-231 cells expressing WT or mutant SP1-mCherry constructs. (C) Images were captured at 40× magnification; nuclei were counterstained with DAPI. Enlarged single-cell images are shown. Quantification of total condensate area (D), average droplet size (E), and droplet count (F), each normalized to values from WT SP1-mCherry-expressing cells. Graphs represent mean ± standard deviation from ten randomly selected fields. Experiments were independently performed twice.
Figure 6.
Figure 6.
RNA influences SP1-mediated transcriptional regulation by modulating SP1 condensation. (A) Schematic of the Bcl3 gene locus near the TSS (top). The genomic positions of the G4-forming sequences in the promoter (dsBcl3 G4) and in the intronic region (RNA G4) are indicated. In vitro condensation assay of SP1-Cy3 with dsBcl3 G4 in the presence or absence of RNA G4 is shown below. (B) In vitro condensation assay of SP1-Cy3 and dsBcl3 G4-Cy5 in the presence of RNA G4 annealed with or without KCl across various DNA:RNA ratios. (C) Quantification of SP1-Cy3 condensate area relative to the condition with DNA:RNA ratio of 1:0 (with KCl). Data represent mean ± standard deviation from ten randomly selected regions. Experiments were independently performed twice. (D) Schematic of time-lapse confocal imaging using the PP7–PCP transcription reporter system following RNA transfection. (E) Representative FS images of MDA-MB-231 cells co-transfected with SP1-mCherry, tdPCP-CFP, and the pGL4.11-Bcl3-12 × PP7 reporter plasmid. After 24 h, media were replaced and cells were transfected with 100 nM G4 RNA or non-G4 RNA. Images were acquired at 40× magnification; close-up views of individual cells are shown. (F–I) Quantification of droplet size and fluorescence intensity over time for SP1-mCherry (F, G) and PCP-CFP (H, I) condensates following transfection with G4 RNA, non-G4 RNA, or no RNA (NTC). Values are shown relative to those at 0 min. Data represent mean ± standard deviation from ten nuclei. Experiments were performed independently twice. (J) Luciferase assay using the pGL4.11-WT reporter plasmid in MDA-MB-231 cells co-transfected with varying concentrations of G4 RNA or non-G4 RNA. Luciferase activity was normalized to Renilla luciferase from co-transfected pRL-TK and expressed relative to non-transfection control. Data represent mean ± standard deviation from at least three independent experiments. (K) Model of SP1 condensation-dependent transcriptional regulation of the Bcl3 gene. Promoter G4 structures facilitate SP1 condensation, which recruits transcriptional coactivators such as MED1 and RNA Pol II to form TCs. Intronic RNA G4 enhances SP1 condensation at low concentrations and dissolves it at high concentrations, providing a positive and negative feedback loop for Bcl3 transcription.

Similar articles

References

    1. Georgakopoulos-Soares I, Morganella S, Jain N et al. Noncanonical secondary structures arising from non-B DNA motifs are determinants of mutagenesis. Genome Res. 2018; 28:1264–71. 10.1101/gr.231688.117. - DOI - PMC - PubMed
    1. Oh KI, Kim J, Park CJ et al. Dynamics studies of DNA with non-canonical structure using NMR spectroscopy. Int J Mol Sci. 2020; 21:1–22. 10.3390/ijms21082673. - DOI - PMC - PubMed
    1. Hur JH, Kang CY, Lee S et al. AC-motif: a DNA motif containing adenine and cytosine repeat plays a role in gene regulation. Nucleic Acids Res. 2021; 49:10150–65. 10.1093/nar/gkab728. - DOI - PMC - PubMed
    1. Ravichandran S, Subramani VK, Kim KK Z-DNA in the genome: from structure to disease. Biophys Rev. 2019; 11:383–7. 10.1007/s12551-019-00534-1. - DOI - PMC - PubMed
    1. Komůrková D, Kovaříková AS, Bártová E G-quadruplex structures colocalize with transcription factories and nuclear speckles surrounded by acetylated and dimethylated histones H3. Int J Mol Sci. 2021; 22:1–18. 10.3390/ijms22041995. - DOI - PMC - PubMed