. 2025 Sep 16;6(9):102317.
doi: 10.1016/j.xcrm.2025.102317. Epub 2025 Aug 29.

Inhibiting KRAS with CD47 and immune checkpoint overcomes intrinsic resistance to combined KRAS and immune checkpoint inhibitor therapy

Affiliations

Inhibiting KRAS with CD47 and immune checkpoint overcomes intrinsic resistance to combined KRAS and immune checkpoint inhibitor therapy

Kentaro Hirade et al. Cell Rep Med. .

Abstract

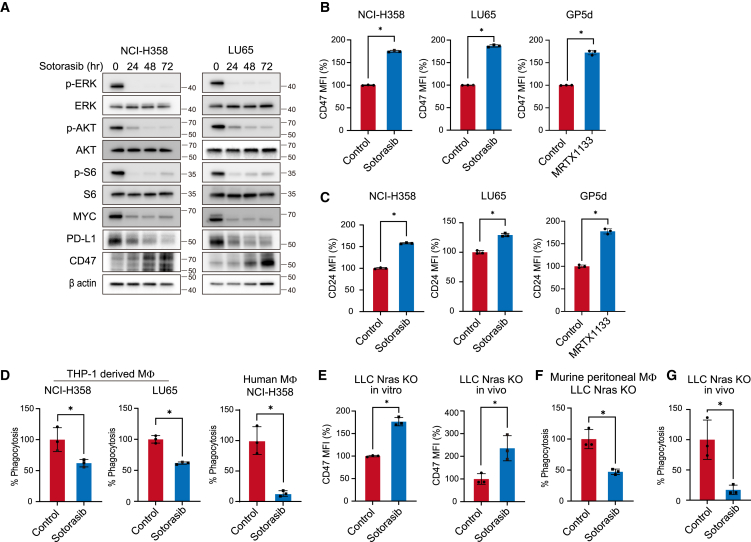
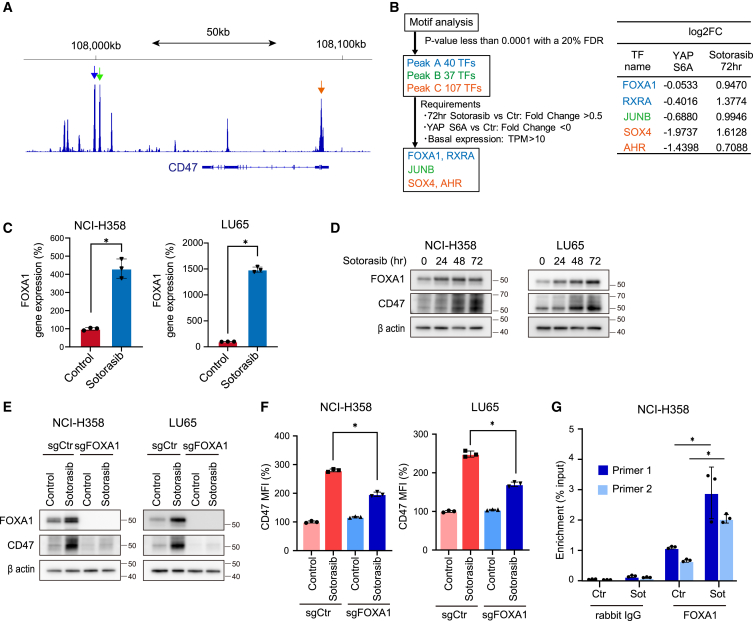
Although Kirsten rat sarcoma virus (KRAS) G12C inhibitors alter the treatment strategy for patients with KRAS G12C-mutant lung cancer, their efficacy remains insufficient to eliminate tumors. Here, we identify that inhibition of mutant KRAS promotes escape from macrophage phagocytosis by upregulating the expression of cluster of differentiation 47 (CD47) and CD24. These proteins are induced by the binding of FOXA1 to the super-enhancer of CD47 and grainyhead-like transcription factor 2 (GRHL2) to the promoter of CD24, respectively. Whereas the addition of an anti-CD47 antibody restores macrophage phagocytosis, phagocytic macrophages induce programmed death-ligand 1 (PD-L1) expression, resulting in the suppression of CD8 T cell activation. Combination of a KRAS inhibitor with anti-CD47 and anti-PD-L1 antibodies achieves long-term survival in an orthotopic murine model recalcitrant to KRAS inhibition with immune checkpoint therapy. These results suggest that targeting KRAS with an anti-CD47 antibody and immune checkpoint blockade is a promising strategy, especially in immune-cold lung tumors.

Keywords: CD47; KRAS mutation; immune checkpoint inhibitor.


Conflict of interest statement

Declaration of interests H.E. and Y.A. are listed on a patent describing the combinatorial therapy reported in this work. H.E. received honoraria from Amgen.

Figures

None
Graphical abstract
Figure 1
Figure 1
Inhibition of KRAS upregulates the expression of CD24 and CD47 (A) NCI-H358 and LU65 KRAS G12C-mutant cancer cell lines were treated with DMSO or 1 μM sotorasib at the indicated time points. Cell lysates were probed with the indicated antibodies. Western blot was repeated three independent times with similar results. (B and C) The mean fluorescent intensity (MFI) of CD47 (B) and CD24 (C) on NCI-H358, LU65, and GP5d cells treated with DMSO or 1 μM sotorasib for 72 h. The data represent MFI ± SD of 3 wells, ∗p < 0.05 by t test. (D) Flow cytometric phagocytosis assay of THP-1-derived macrophages against NCI-H358 and LU65 cells and human monocyte-derived macrophages against NCI-H358 cells. Tumor cells were treated with DMSO or 1 μM sotorasib for 72 h and then stained with CFSE. THP-1-derived macrophages and human monocyte-derived macrophages were labeled with PKH-26 staining solution. Subsequently, tumor cells were co-cultured with macrophages at a 1:1 ratio for 2 h. The percentage of both CFSE- and PKH-positive cells among PKH-positive cells was measured using flow cytometry and compared between DMSO- and sotorasib-treated cells. The data represent mean ± SD of 3 independent experiments, ∗p < 0.05 by t test. (E) The MFI of CD47 on LLC Nras KO cells following inhibition of mutant KRAS. For in vitro analysis, LLC Nras KO cells were treated with DMSO or 1 μM sotorasib for 72 h. For in vivo experiments, enhanced green fluorescent protein (EGFP)-labeled LLC Nras KO syngeneic lung tumors were treated with vehicle or 100 mg/kg sotorasib for 3 days. Among the EGFP-positive cells, the MFI of CD47 was measured using flow cytometry with anti-CD47 antibodies. The data represent MFI ± SD of 3 independent wells or mice, respectively, ∗p < 0.05 by t test. (F) Flow cytometric phagocytosis assay of murine peritoneal macrophages against LLC Nras KO cells assessed as in (E). The data represent mean ± SD of 3 independent experiments, ∗p < 0.05 by t test. (G) EGFP-labeled LLC Nras KO syngeneic lung tumors were treated with vehicle or 100 mg/kg sotorasib for 3 days. Then tumors were collected, dissociated, and labeled with F4/80 antibody. The percentage of both EGFP- and F4/80-positive cells among F4/80-positive cells was measured using flow cytometry and compared between vehicle- and sotorasib-treated mice. The data represent mean ± SD of 3 independent mice, ∗p < 0.05 by t test.
Figure 2
Figure 2
FOXA1 binds to the super-enhancer region of CD47 and regulates its expression (A) ATAC-seq signal for the CD47 gene in NCI-H358 cells. Arrows are pile-up reads in super-enhancer regions (peak A, blue; and peak B, green) and a promoter region (peak C, orange). (B) Flowchart identifying transcription factors that regulate CD47 is shown on the left. Fold change in expression of each candidate transcription factor in NCI-H358 cells transfected with constitutively active YAP (YAP S6A) or in NCI-H358 cells treated with 1 μM sotorasib for 72 h relative to NCI-H358 cells is shown on the right. (C) qPCR analysis of mRNA levels of FOXA1 normalized to ubiquitin following treatment with 1 μM sotorasib for 72 h in NCI-H358 and LU65 cells. Data are mean ± SD (n = 3 independently treated cell cultures, two-sided Student’s t test, ∗p < 0.05). (D) NCI-H358 and LU65 cells were treated with DMSO or 1 μM sotorasib at the indicated time points. Cell lysates were probed with the indicated antibodies. (E and F) NCI-H358 and LU65 cells transduced with control sgRNA or sgFOXA1 were treated with 1 μM sotorasib for 72 h. Cell lysates were probed with the indicated antibodies. Western blot was repeated 2 independent times with similar results (E). The MFI of CD47 on NCI-H358 and LU65 cells is shown (F). The data represent MFI ± SD of 3 wells, ∗p < 0.05 by t test. (G) ChIP-qPCR analysis shows significantly more enrichment of FOXA1 at the super-enhancer regions of the CD47 gene. Data are mean ± SD (n = 3 independently treated cell cultures, two-sided Student’s t test, ∗p < 0.05).
Figure 3
Figure 3
Inhibition of KRAS and CD47 induces a phenotypic change in macrophages (A–C) Flow cytometric phagocytosis assay of THP-1-derived macrophages against NCI-H358 and LU65 cells (A), human monocyte-derived macrophages against NCI-H358 cells (B), and murine peritoneal macrophages against LLC Nras KO cells (C). Tumor cells were treated with DMSO or 1 μM sotorasib for 72 h and then co-cultured with macrophages at a 1:1 ratio for 2 h with or without 2 μg/mL anti-CD47. The data represent mean ± SD of 3 independent experiments, ∗ two-sided Student’s t test with Bonferroni correction, p < 0.05. (D) Phagocytosis assay in vivo. EGFP-labeled LLC Nras KO syngeneic lung tumors were treated with vehicle, sotorasib (100 mg/kg), anti-CD47 (100 μg/body), or the combination of these drugs at the same doses for 3 days. The data represent mean ± SD of 3 independent mice, ∗ two-sided Student’s t test with Bonferroni correction, p < 0.05. (E) LLC Nras KO syngeneic lung tumors were treated with vehicle, sotorasib (100 mg/kg), anti-CD47 (100 μg/body), or the combination of these drugs at the same doses for 3 days. Tumors were harvested and subjected to fluorescence immunostaining with the indicated antibodies. Scale bars, 100 μm. (F) LLC Nras KO syngeneic lung tumors were treated as in (E). Gene expression of Adgre1 was visualized as yellow. Scale bars, 1 mm. (G) UMAP visualization of merged sequencing profiles from tumors of each cohort with cells colored and labeled according to cell type. (H) A 100% stacked bar graph showing the proportion of macrophages classified into each cluster. (I) The spatial distribution of each macrophage cluster in each cohort. Scale bars, 1 mm. (J) The top 15 most significantly upregulated genes in clusters 1, 3, and 11. The complete list is included in Table S2. (K) LLC Nras KO syngeneic lung tumors were treated as in (E) and subjected to fluorescence immunostaining with the indicated antibodies. Scale bars, 100 μm. (L) Phagocytosis assay in vivo. Percentage of phagocytic macrophages was defined by the ratio of EGFP-positive cells among iNOS- or CD206-positive macrophages, respectively, in EGFP+ LLC Nras KO syngeneic lung tumors. The data represent mean ± SD of 3 mice, ∗p < 0.05 by t test.
Figure 4
Figure 4
Phagocytosis induces PD-L1 expression on macrophages (A) qPCR analysis of mRNA levels of PD-L1 normalized to ubiquitin in non-phagocytic and phagocytic macrophages co-cultured with NCI-H358 cells for 24 h. Data are mean ± SD (n = 3 independently treated cell cultures, two-sided Student’s t test, ∗p < 0.05). (B) The upregulation of PD-L1 MFI following phagocytosis of THP-1-derived macrophages by co-culture with NCI-H358 and LU65 cells for 2 h. The data represent MFI ± SD of 3 wells, two-sided Student’s t test, ∗p < 0.05. (C) Human monocyte-derived macrophages were co-cultured with NCI-H358 cells for 2 h, and PD-L1 expression was compared between non-phagocytic and phagocytic macrophages. The data represent MFI ±SD of 3 independently treated cell cultures, two-sided Student’s t test, ∗p < 0.05. (D) The upregulation of PD-L1 MFI following phagocytosis of murine peritoneal macrophages by co-culture with LLC Nras KO cells for 2 h. The data represent MFI ± SD of 3 wells, two-sided Student’s t test, ∗p < 0.05. (E) Upregulation of PD-L1 MFI on phagocytic macrophages in vivo. LLC Nras KO syngeneic lung tumors were treated with vehicle, sotorasib (100mg/kg), anti-CD47 (100μg/body), or the combination of these drugs at the same doses for 3 days. The data represent MFI ± SD of 3 mice, two-sided Student’s t test with Bonferroni correction, ∗p < 0.05. (F) PD-L1 expression in the tumor microenvironment of LLC Nras KO syngeneic lung tumors. Tumors were harvested and subjected to fluorescence immunostaining with the indicated antibodies. Scale bars, 50 μm. (G) LLC Nras KO syngeneic lung tumors were treated with vehicle, sotorasib (100 mg/kg), anti-CD47 (100 μg/body), or the combination of these drugs at the same doses for 3 days. Tumors were harvested and subjected to fluorescence immunostaining with the indicated antibodies. Scale bars, 100 μm. (H) Quantitative analyses of PD-L1-positive cells. The y axis represents the number of positive cells for each determinant per ×20 microscopic field (n = 5 mice/group, with at least 3 fields per slide). The data are presented as the mean ± SD. ∗p < 0.05 by Mann-Whitney U tests with Bonferroni correction.
Figure 5
Figure 5
KRAS inhibition combined with anti-CD47 and immune checkpoint blockade results in enhanced efficacy (A) Tumor-associated macrophages suppressed T cell activation that was relieved by anti-PD-L1 antibody. CD8 T cells isolated from C57BL/6 mouse spleen were seeded into plates pre-coated with anti-CD3 antibody and cultured for 24 h in medium supplemented with the anti-CD28 antibody. Tumor-associated macrophages were generated from co-culture of mouse peritoneal macrophages with LLC Nras KO cells for 24 h. Then, tumor-associated macrophages, CD8 T cells, and a mixture of these cells were cultured with or without 10 μg/mL anti-PD-L1 antibody for 24 h. T cell activation was measured by IFN-γ secretion in each media. The data represent mean ± SD of 3 co-cultures, two-sided Student’s t test with Bonferroni correction, ∗p < 0.05. (B–F) Representative immunofluorescence images (B) and quantitative analyses (C–F) showing indicated immune cells infiltrating tumors. The y axis represents the number of positive cells for each determinant per ×20 microscopic field (n = 5 mice/group, with at least 3 fields per slide). LLC Nras KO syngeneic lung tumors were treated with vehicle, sotorasib (100 mg/kg), anti-CD47 antibody (100 μg/body), atezolizumab (20 mg/kg), or the combination of these drugs as indicated for 3 days. Tumors were harvested and subjected to fluorescence immunostaining with the indicated antibodies. Scale bars: 20 μm. The data are presented as the mean ± SD. ∗p < 0.05 by Mann-Whitney U tests with Bonferroni correction. (G) LLC Nras KO tumors were treated with vehicle, 50 mg/kg sotorasib daily, anti-CD47 antibody 50 μg/body three times a week, atezolizumab 10 mg/kg twice a week, or a combination of these drugs as indicated. Treatments were finished on day 56, and mice were followed until 1 year. Kaplan-Meier survival curve of mice in each group. Significance was determined by a log rank test, ∗p < 0.001.

References

    1. Prior I.A., Hood F.E., Hartley J.L. The Frequency of Ras Mutations in Cancer. Cancer Res. 2020;80:2969–2974. doi: 10.1158/0008-5472.CAN-19-3682. - DOI - PMC - PubMed
    1. Pylayeva-Gupta Y., Grabocka E., Bar-Sagi D. RAS oncogenes: weaving a tumorigenic web. Nat. Rev. Cancer. 2011;11:761–774. doi: 10.1038/nrc3106. - DOI - PMC - PubMed
    1. Liao W., Overman M.J., Boutin A.T., Shang X., Zhao D., Dey P., Li J., Wang G., Lan Z., Li J., et al. KRAS-IRF2 Axis Drives Immune Suppression and Immune Therapy Resistance in Colorectal Cancer. Cancer Cell. 2019;35:559–572.e7. doi: 10.1016/j.ccell.2019.02.008. - DOI - PMC - PubMed
    1. Mugarza E., van Maldegem F., Boumelha J., Moore C., Rana S., Llorian Sopena M., East P., Ambler R., Anastasiou P., Romero-Clavijo P., et al. Therapeutic KRAS(G12C) inhibition drives effective interferon-mediated antitumor immunity in immunogenic lung cancers. Sci. Adv. 2022;8 doi: 10.1126/sciadv.abm8780. - DOI - PMC - PubMed
    1. Muthalagu N., Monteverde T., Raffo-Iraolagoitia X., Wiesheu R., Whyte D., Hedley A., Laing S., Kruspig B., Upstill-Goddard R., Shaw R., et al. Repression of the Type I Interferon Pathway Underlies MYC- and KRAS-Dependent Evasion of NK and B Cells in Pancreatic Ductal Adenocarcinoma. Cancer Discov. 2020;10:872–887. doi: 10.1158/2159-8290.CD-19-0620. - DOI - PMC - PubMed

MeSH terms