. 2025 Aug 30;16(1):8120.
doi: 10.1038/s41467-025-63415-0.

Modulating tumor collagen fiber alignment for enhanced lung cancer immunotherapy via inhaled RNA

Affiliations

Modulating tumor collagen fiber alignment for enhanced lung cancer immunotherapy via inhaled RNA

Bin Hu et al. Nat Commun. .

Abstract

The clinical effectiveness of immunotherapies for lung cancers has been greatly hindered by the immune-excluded and immunosuppressive tumor microenvironment (TME) and limited pulmonary accessibility of therapeutics. Here, we develop an inhalable lipid nanoparticle (LNP) system that enables simultaneous delivery of mRNA encoding anti-discoidin domain receptor 1 (DDR1) single-chain variable fragments (mscFv) and siRNA targeting PD-L1 (siPD-L1) into pulmonary cancer cells. The secreted anti-DDR1 scFv blocks the binding of DDR1 extracellular domain to collagen, disrupting collagen fiber alignment and reducing tumor stiffness, thereby facilitating T cell infiltration. Meanwhile, PD-L1 silencing alleviates immunosuppression and preserves T cell cytotoxicity. In vivo results demonstrate that mscFv@LNP induces collagen fiber rearrangement and diminishes tumor stiffness. In both orthotopic and metastatic mouse models of lung cancer, inhalation of mscFv/siPD-L1@LNP promotes tumor regression and extends overall survival. This strategy could be broadly applicable to solid tumors and benefit other cancer immunotherapies by addressing the universally hostile TME involved in tumor progression.


Conflict of interest statement

Competing interests: The authors declare no competing interests.

Figures
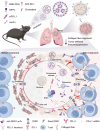
Fig. 1
Fig. 1. Schematic illustration of the antitumor immunity induced by the inhalation of mscFv/siPD-L1@LNP.
Lung tumor-bearing mice are administered LNP co-delivering mscFv and siPD-L1 via inhalation. Following the internalization of LNP by cancer cells, mscFv and siPD-L1 are simultaneously released, translating into anti-DDR1 scFv and knocking down PD-L1 expression, respectively. The secreted anti-DDR1 scFv binds to DDR1 ECD, blocking its interaction with collagen, which disrupts collagen fiber alignment and reduces tumor stiffness. This creates a tumor microenvironment more favorable for immune effector cell infiltration. Consequently, antitumor immunity is enhanced by overcoming both the physical and immune barriers of the tumor’s defense mechanisms.
Fig. 2
Fig. 2. Nebulized LNP enables efficient and desirable cellular uptake, transfection, gene silencing, and gene expression both in vitro and in vivo.
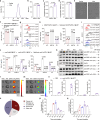
ae Size distribution (a), particle size (n = 3 independent samples) (b), polydispersity index (PDI) (n = 3 independent samples) (c), encapsulation efficiency (n = 3 independent samples) (d), and representative cryo-TEM images (e) of mscFv/siPD-L1@LNP before and after nebulization. Scale bar: 100 nm. Data were representative of three independent experimental replicates with similar results. f Mean fluorescence intensity (MFI) of LLC, B16F10, and 4T1 cells treated with Cy5-labled mscFv/siPD-L1@LNP or nebulized mscFv/siPD-L1@LNP for 4 h (n = 3 biologically independent samples). g,h Representative flow cytometric histogram (g) and relative quantifications of EGFP-positive cells and MFI of EGFP (h) in LLC, B16F10, and 4T1 cells following treatment with mEGFP/siPD-L1@LNP or nebulized mEGFP/siPD-L1@LNP for 24 h (n = 3 biologically independent samples). i,j Representative flow cytometric histogram (i) and relative quantifications of PD-L1-positive cells and MFI of PD-L1 (j) in LLC, B16F10, and 4T1 cells following treatment with mscFv/siPD-L1@LNP or nebulized mscFv/siPD-L1@LNP for 48 h (n = 3 biologically independent samples). k LNP-mediated mscFv expression in cell lysis (CL) and supernatant (SN) at different time points following transfection of LLC, B16F10, and 4T1 cells. Data were representative of three independent experimental replicates with similar results. l, m IVIS imaging of Cy5-labled LNP signals (l) and luciferase signals (m) in major organs of mice 6 h after inhalation of mLuc@LNPCy5 (n = 3 mice). n Percentage of different cell subtypes internalizing Cy5-labeled mscFv/siPD-L1@LNP 6 h post-inhalation (n = 3 mice). o Uptake distribution of mscFv/siPD-L1@LNPCy5 across different cell subtypes 6 h post-inhalation (n = 3 mice). Flow cytometry gating strategies are shown in Supplementary Fig. 26. p, q Concentration of DDR1 scFv in lung homogenate (p) and bronchoalveolar lavage fluid (q) at different time points following a single-dose inhalation of mscFv/siPD-L1@LNP (n = 3 mice). Results are presented as mean ± s.d. Statistical analysis was performed using two-tailed unpaired Student’s t-test (bd, f, h) or by one-way ANOVA with Bonferroni’s multiple comparisons test (j). P values as indicated. Source data are provided as a Source Data file.
Fig. 3
Fig. 3. mscFv/siPD-L1@LNP demonstrates excellent antitumor effects in vitro.
ad Representative flow cytometric analysis profiles (a) and relative quantifications of apoptotic LLC cells (b), B16F10 cells (c), and 4T1 cells (d) following co-culture with activated CD8+ T cells for 24 h (n = 3 biologically independent samples). The cancer cells were pretreated with the specified formulations four hours prior to co-culturing with T cells. eg Quantification of granzyme B+ (e), IFN-γ+ (f), and TNF-α+ (g) T cells following co-culture of LLC cells with CD8+ T cells using flow cytometry (n = 3 biologically independent samples). h Determination of TNF-α, IL-1β, IL-6, and IL-10 levels in the supernatant of co-cultured LLC cells and CD8+ T cells. Data were representative of three independent experimental replicates with similar results. Results are presented as mean ± s.d. Statistical analysis was performed using one-way ANOVA with Bonferroni’s multiple comparisons test (bg). P values as indicated. Source data are provided as a Source Data file.
Fig. 4
Fig. 4. mscFv@LNP promotes immune infiltration by disrupting collagen fiber alignment and reducing tumor stiffness.
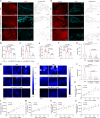
a Representative images of PI-stained nuclei, SHG, and collagen fiber individualization in LLC lung tumors with the indicated treatments. Scale bar: 50 μm. Data were representative of three independent experimental replicates with similar results. b,c Coefficient of alignment (b) and length (c) of collagen fibers in LLC lung tumors following different treatments (n = 5 mice). d Representative images of PI-stained nuclei, SHG, and collagen fiber individualization in 4T1 metastatic lung tumors with indicated treatments. Scale bar: 50 μm. Data were representative of three independent experimental replicates with similar results. ef Coefficient of alignment (e) and length (f) of collagen fibers in 4T1 metastatic lung tumor following different treatments (n = 5 mice). g, h Stiffness map (g) and quantification of tissue stiffness (h) in LLC lung tumors with indicated treatments (n = 3 mice). Data were representative of three independent experimental replicates with similar results. i-j, Stiffness map (i) and quantification of tissue stiffness (j) in 4T1 metastatic lung tumors with indicated treatments (n = 3 mice). Data were representative of three independent experimental replicates with similar results. ko Correlation analysis of mscFv dose and the infiltration of CD45+ immune cells (k), CD4+ T cells (l), CD8+ T cells (m), NK cells (n), and NKT cells (o) into LLC lung tumors (n = 3 mice for each dosage). Flow cytometry gating strategies are shown in Supplementary Fig. 27. Results are presented as mean ± s.d. Statistical analysis was performed using one-way ANOVA with Bonferroni’s multiple comparisons test (b, c, e, f), Brown–Forsythe and Welch ANOVA tests with Games–Howell’s multiple comparisons test (h, j), or Pearson correlation analysis with a two-tailed test (ko). P values as indicated. Source data are provided as a Source Data file.
Fig. 5
Fig. 5. Inhalation of mscFv/siPD-L1@LNP retards tumor progression in an orthotopic mouse model of lung cancer.
a Schematic illustration of the inoculation of LLC-Luc cells via orthotopic injection and the following treatment and analysis schedules. b,c In vivo bioluminescence images reveal the tumor burden in mice receiving different treatments at indicated time points (b) and quantification of luciferase signals from each individual mouse (c) (n = 5 mice). d Representative H&E-stained lung sections from mice following indicated treatments on day 17. Scale bar: 200 μm. Data were representative of three independent experimental replicates with similar results. e Body weight of mice from different treatment groups, normalized to day 0 (n = 5 mice). f Lung weight of mice from different treatment groups serves as a proxy for tumor burden (n = 5 mice). g Kaplan–Meier survival curves and median survival time of tumor-bearing mice (n = 6 mice). h Representative images of picrosirius red-stained lung tumor, examined under polarized light microscopy. Scale bar: 100 μm. Data were representative of three independent experimental replicates with similar results. i Quantification of collagen fiber length (n = 5 mice). j Representative immunofluorescence images for PD-L1 expression in lung tumor areas. Scale bar: 50 μm. Data were representative of three independent experimental replicates with similar results. Results are presented as mean ± s.d. Statistical analysis was performed using one-way ANOVA with Bonferroni’s multiple comparisons test (e,f, i) or by log-rank (Mantel–Cox) test (g). P values as indicated. Source data are provided as a Source Data file.
Fig. 6
Fig. 6. Inhalation of mscFv/siPD-L1@LNP reconstructs the immune-excluded and immunosuppressive TME in the LLC tumor model.
a Schematic illustration of the treatment and analysis schedule for mice bearing orthotopic LLC tumors. bf Representative flow cytometric analysis profiles and relative quantifications of CD8+ T cells (CD45+CD3+CD8+) (b), Treg cells (CD45+CD4+FOXP3+) (c), MDSCs (CD45+CD11b+Gr-1+) (d), IFN-γ-secreting CD8+ T cells (CD45+CD3+CD8+IFN-γ+) (e), and CD8+ T cell proliferation (CD45+CD3+CD8+Ki67+) (f) within the TME following the indicated treatments. gi Quantification of the infiltration of CD45+ immune cells (g), CD4+ T cells (h), and CD8+ T cells (i) into lung tumors using flow cytometry. jn ELISA analysis of IFN-γ (j), IL-2 (k), IL-12p70 (l), TNF-α (m), and IL-10 (n) levels in lung tumors of mice following the indicated treatments. Flow cytometry gating strategies are shown in Supplementary Fig. 28. All data are from n = 5 mice and are presented as mean ± s.d. Statistical analysis was performed using one-way ANOVA with Bonferroni’s multiple comparisons test. P values as indicated. Source data are provided as a Source Data file.
Fig. 7
Fig. 7. Inhalation of mscFv/siPD-L1@LNP inhibits the progression of 4T1 breast cancer lung metastasis through TME reconstruction.
a Schematic illustration of the inoculation of breast cancer lung metastasis via intravenous injection of 4T1-Luc cells and the following treatment and analysis schedules. b,c In vivo bioluminescence images reveal the tumor burden in mice receiving different treatments at indicated time points (b) and quantification of luciferase signals from each individual mouse (c) (n = 5 mice). d Representative image of metastatic lungs, with white circles indicating the metastatic foci. e Representative H&E-stained lung sections from mice following indicated treatments on day 18. Scale bar: 2 mm. Data were representative of three independent experimental replicates with similar results. f Number of metastatic foci on the lung surface following the indicated treatments (n = 5 mice). g Lung weight of mice from different treatment groups (n = 5 mice). h Kaplan–Meier survival curves and median survival time of tumor-bearing mice (n = 7 mice). i,j Quantified flow cytometry analysis of Treg cells (CD45+CD4+FOXP3+) (i) and MDSCs (CD45+CD11b+Gr-1+) (j) within the TME following the indicated treatments (n = 5 mice). ko Quantification of the infiltration of CD45+ immune cells (k), CD4+ T cells (l), CD8+ T cells (m), NK cells (n), and NKT cells (o) into lung tumors using flow cytometry (n = 5 mice). Flow cytometry gating strategies are shown in Supplementary Fig. 29. Results are presented as mean ± s.d. Statistical analysis was performed using one-way ANOVA with Bonferroni’s multiple comparisons test (f,g, io) or by log-rank (Mantel–Cox) test (h). P values as indicated. Source data are provided as a Source Data file.

Similar articles

References

    1. Waldman, A. D., Fritz, J. M. & Lenardo, M. J. A guide to cancer immunotherapy: from T cell basic science to clinical practice. Nat. Rev. Immunol.20, 651–668 (2020). - PMC - PubMed
    1. Meric-Bernstam, F., Larkin, J., Tabernero, J. & Bonini, C. Enhancing anti-tumour efficacy with immunotherapy combinations. Lancet397, 1010–1022 (2021). - PubMed
    1. Kelly, P. N. The Cancer Immunotherapy Revolution. Science359, 1344–1345 (2018). - PubMed
    1. Jin, M.-Z. & Jin, W.-L. The updated landscape of tumor microenvironment and drug repurposing. Signal Transduct. Target. Ther.5, 166 (2020). - PMC - PubMed
    1. Chen, X. et al. Non-invasive activation of intratumoural gene editing for improved adoptive T-cell therapy in solid tumours. Nat. Nanotechnol.18, 933 (2023). - PubMed

MeSH terms