. 2025 Aug 30;16(1):8128.
doi: 10.1038/s41467-025-63458-3.

Targeting phagocytosis for amyloid-β clearance: implications of morphology remodeling and microglia activation probed by bifunctional chimaeras

Affiliations

Targeting phagocytosis for amyloid-β clearance: implications of morphology remodeling and microglia activation probed by bifunctional chimaeras

Youqiao Wang et al. Nat Commun. .

Abstract

Amyloid-β (Aβ), a key driver of Alzheimer's disease (AD) pathogenesis, possesses diverse harmful and clearance-resistant structures that present substantial challenges to therapeutic development. Here, we demonstrate that modulating Aβ morphology, rather than Toll-like receptor 2 (TLR2)-dependent microglia activation, is essential for effective phagocytosis of Aβ species by microglia. By developing a bifunctional mechanistic probe (P2CSKn) designed to remodel Aβ and activate TLR2, we show it restructures soluble Aβ (sAβ) and fibrillar Aβ (fAβ) into less toxic hybrid aggregates (hPAβ). Critically, this structural remodeling protects microglia from Aβ toxicity while enabling robust phagocytosis. Moreover, although TLR2 activation mildly enhances Aβ uptake, it concurrently triggers detrimental inflammation that negates its benefits. Our findings establish morphological remodeling as the critical determinant of effective Aβ clearance and suggest a morphology-focused strategy for developing safe therapeutics for Aβ-related diseases.


Conflict of interest statement

Competing interests: The authors declare no competing interests.

Figures
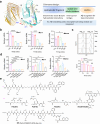
Fig. 1
Fig. 1. Design of multifunctional chimaera.
a The cryo-EM structures of fAβ42 (pdb code: 5OQV) and proposed strategy for chimaera design. The image was generated by MOE 2015.10, and key interactions involved residues are shown. CT C-terminal, NT N-terminal. b The effects of fAβ42 (0.5 μM) on the expression of mRNA of Marco, Msr1 and Mrc1 in BV2 cells after incubation with cells for different amount of time, as determined by rt-qPCR. c Effects of fAβ42 treatment on the phagocytosis of fluorescent microsphere in BV2 cells, as measured by flow cytometry. d Effects of various TLR agonists on the expression of mRNA of Marco, Msr1 and Mrc1 in BV2 cells, as determined by rt-qPCR. LPS (1.0 μg/mL), Pam3CSK4 (1.0 μM), Pam2CSK4 (1.0 μM), Zymosan A (50 μg/mL), Flagellin (200 nM) were used. e Structures of designed chimaeras and reference compounds. RP, Random Peptide. Data are representative of three independent experiments in (bd). Data are presented as mean ± SD, n = 3 independent samples in (bd) using one-way ANOVA with Dunnett’s post hoc test. ns, not significant, *p < 0.05, **p < 0.01, ***p < 0.001, ****p < 0.0001. Exact p values were given in the Source Data file. Source data are provided as a Source Data file.
Fig. 2
Fig. 2. P2CSKn co-assembles with sAβ42 to form conformation-modified hybrid aggregates.
a Tyndall Effects in sAβ42 solution with or without gradient concentration of P2CSKn, Pam2CSK4 and KLVFFn, respectively. b Effects of different concentrations of P2CSKn, Pam2CSK4 and KLVFFn on the particle size of sAβ42, assessed using DLS. c The effect P2CSKn and reference compound on the formation of Aβ42 oligomers, time- (top) and concentration-(bottom) course effects were evaluated using Dot Blot with oligomer-specific antibody A11. d Representative morphology of RhoB-P2CSKn treated sFITC-Aβ42 (12 h) captured using LSCM. The colocalization of RhoB (Rhodamine B) and FITC is analyzed using Image J (v 1.54 g). e ThT fluorescence intensity kinetics of sAβ42 (10 μM) with or without P2CSKn (50 μM). 10 μM ThT was used, and the fluorescence was monitored before and after the addition of P2CSKn. The fluorescence intensity at the endpoint was measured for statistical analysis. f Far-UV CD spectra of sAβ42 in the absence or presence of different concentrations of P2CSKn in 50.0 mM phosphate buffer (pH 7.4) without Cl-. Curves were calibrated by subtracting the basic signal from phosphate buffer. g MST spectra of different concentrations of P2CSKn on sFITC-Aβ42 (0.5 μM), data were processed by MO. Affinity Analysis v2.3, and the curve was fitted using the Hill model to afford Kd. Data are representative of three independent experiments with similar results in (a, c, d). Data are presented as mean ± SD, n = 4 independent samples in (e) using two-tailed t tests. ****p < 0.0001. Exact p values were given in the Source Data file. Source data are provided as a Source Data file.
Fig. 3
Fig. 3. P2CSKn re-assembles fAβ42 to conformation- and morphology-modified hybrid aggregates.
a The effects of P2CSKn (50 μM) on ThT fluorescence intensity of fAβ42 (10 μM). b Far-UV CD spectra of fAβ42 in the absence or presence of different concentrations of P2CSKn in 50.0 mM phosphate buffer (pH 7.4) without Cl-. P2CSKn were incubated with fAβ42 for 12 h at 37°C before the determination. Curves are calibrated by subtracting the basic signal from phosphate buffer. c Oligomer alterations in fAβ42 (20 μM) with P2CSKn at different concentrations and incubation time, as determined using PICUP-Western Blot with Aβ antibody 4G8. d Representative morphology of fAβ42 (20 μM) in the presence or absence of 2.0 eq. P2CSKn for different incubation time points, as determined using TEM imaging. Scale bar, 500 nm. Fibril diameters are determined using Image J (v 1.54 g). e, f Dynamic morphology of fFITC-Aβ42 (5.0 μM) after injection of RhoB-P2CSKn (25 μM), as captured using LSCM. e Dynamic fluorescence area of Rhodamine B within FITC area in plaques or the entire field of view. Images show selected fFITC-Aβ42 plaques at 0 min, and the curves show the time-course of colocalization. f Representative images show the reassembling process as reflected by dynamic colocalization of RhoB with FITC in representative plaque (P6 in e) at different time points. Colocalization analysis was performed using Image J (v 1.54 g). g Time-dependent hydrodynamic diameter distributions of P2CSKn, fAβ42 or their mixture, assessed using DLS. Data are representative of three independent experiments with similar results in (c, e, f). Data represented as mean ± SD, n = 7 randomly measured fibrils diameter of all fields of each sample in (d), n = 4 independent samples in (a). Statistical significance in (d) was assessed using one-way ANOVA with Dunnett’s post hoc test. ns, not significant, *p < 0.05, ****p < 0.0001. Exact p values were given in the Source Data file. Source data are provided as a Source Data file.
Fig. 4
Fig. 4. P2CSKn promotes ingestion of Aβ42 species in different cell models.
a Intracellular accumulation of BV2 cells of sFITC-Aβ42 (0.5 μM) or P2CSKn (1.0 μM)-pretreated sFITC-Aβ42 (0.5 μM), as indicated by intracellular fluorescence ratio of FITC to Hoechst 33342 after incubation of cells with different FITC-Aβ42 forms. bd Phagocytosis of different forms of FITC-Aβ42 in cells, as determined using Flow cytometry. b sFITC-Aβ42 (0.5 μM) pre-treated with or without 2 eq. P2CSKn or Pam2CSK4. c fFITC-Aβ42 (0.5 μM) pre-treated with or without 8 eq. P2CSKn or Pam2CSK4. d sFITC-Aβ42 (0.5 μM) pre-treated with or without 2 eq. P2CSKn. e The phagocytosis of 0.5 μM sFITC-Aβ42 or fFITC-Aβ42 pre-treated with a gradient concentration of P2CSKn. The EC50 was fitted using count-concentration curves. f Dynamic process of BV2 cells phagocytizing 0.5 μM fFITC-Aβ42, or sFITC-Aβ42 pretreated with 0.5 μM P2CSKn or RhoB-P2CSKn respectively, as imaged by LSCM. g The colocalization of 1.0 eq. P2CSKn-pretreated sFITC-Aβ42 (0.5 μM) with LysoTracker Red (DND99) in BV2 cells, in the absence or presence of chloroquine (10 μM). Images are recorded using LSCM and colocalization analysis was performed using Image J (v 1.54 g). h Degradation of different FITC-Aβ42 forms in BV2 cells. 0.5 μM sFITC-Aβ42 and fFITC-Aβ42, as well as preformed hPFAβ42 (0.5 μM sFITC-Aβ42 + 1.0 μM P2CSKn) were incubated respectively with cells for 180 min and washed off, then the fluorescence was recorded at indicated time points. Relative intracellular FITC-Aβ42 was indicated using the fluorescence ratio of FITC to Hoechst 33342, and normalized to the raw data at 0 min of each group. Data are representative of three independent experiments with similar results in (f, g), or three independent experiments in (be). Data are presented as mean ± SD, n = 3 (be), n = 6 (a), n = 8 (h) independent samples using one-way ANOVA with Dunnett’s post hoc test. ns, not significant, ****p < 0.0001. Exact p values were given in the Source Data file. Source data are provided as a Source Data file.
Fig. 5
Fig. 5. The effects of BV2 cell activation on P2CSKn-facilitated phagocytosis.
a The phagocytosis of 0.5 μM sFITC-Aβ42 and fFITC-Aβ42, as well as preformed hPFAβ42 (0.5 μM sFITC-Aβ42 pretreated with 1.0 μM P2CSKn) in TLR2-WT and TLR2-knockdown BV2 cells, as determined by Flow cytometry. NC: negative control. b Effects of P2CSKn (0.5 μM) and different forms of Aβ42 (0.5 μM) on the mRNA expression of iNOS and Tnfα in BV2 cells, as determined using rt-qPCR. hPAβ42 was performed by treating 0.5 μM sAβ42 with 1.0 μM P2CSKn. c Protein levels of MARCO, MSR1, TLR2 and NLRP3 in BV2 cells treated with fAβ42 (0.5 μM), 1.0 μM P2CSKn, Pam2CSK4 or KLVFFn, and 1.0 μM P2CSKn, Pam2CSK4 or KLVFFn-pretreated sAβ42 (0.5 μM), respectively. Cell lysate was harvested after 12 hr incubation and examined using Western Blot. d mRNA expression of Marco and Msr1 in BV2 cells treated with fAβ42 (0.5 μM), 1.0 μM P2CSKn, Pam2CSK4 or KLVFFn, as well as 1.0 μM P2CSKn, Pam2CSK4 or KLVFFn-pretreated sAβ42 (0.5 μM), for 12 hr, respectively. mRNA level of each gene was determined by rt-qPCR. e Immunofluorescence of Iba1 in TLR2-WT or TLR2-knockdown BV2 cells treated with P2CSKn (1.0 μM), 0.5 μM sAβ42, fAβ42, and preformed hPAβ42 by treating 0.5 μM sAβ42 with 1.0 μM P2CSKn. f Phagocytosis of fFITC-Aβ42 in BV2 cells with or without pretreatment of 1.0 μM P2CSKn or Pam2CSK4, respectively, as determined using Flow cytometry. P2CSKn or Pam2CSK4 was added to the cells for 6 h then washed before addition of fFITC-Aβ42 for 12 h incubation with cells. Data are representative of three independent experiments with similar results in (e), or three independent experiments in (ad, f). Data are presented as mean ± SD, n = 3 independent samples in (a-d,f) using one-way ANOVA with Dunnett’s post hoc test (bf) or two-tailed t tests (a). ns, not significant, *p < 0.05, **p < 0.01, ***p < 0.001, ****p < 0.0001. Exact p values were given in the Source Data file. Source data are provided as a Source Data file.
Fig. 6
Fig. 6. The effects of morphology remodeling of Aβ42 species by P2CSKn on phagocytosis.
a The cellular distribution of TLR2 and sFITC-Aβ42 (0.5 μM) with or without pretreatment with RhoB-P2CSKn (1.0 μM). Images were recorded using LSCM and colocalization analysis was performed using Image J (v 1.54g). b CETSA of TLR2 in BV2 cells in the presence of 2.0 eq. P2CSKn pretreated sAβ42 examined by Western blot. c Cell viability of BV2 cells in the presence of various concentrations of P2CSKn for 24 h, as determined using CCK8 assay. d Effects of different compounds (1.0 μM) and Aβ42 (0.5 μM) on the apoptosis in BV2 cells. Green dots indicate fluorescence released by activated capases-3 from GreenNucr Caspase-3 Substrate. e Expression of cleaved forms of PARP and caspase-3 in BV2 cells treated with sAβ42 or fAβ42, and P2CSKn, and P2CSKn pretreated sAβ42, respectively, as measured using Western Blot after 12 h incubation. f Expression of cleaved forms of PARP in BV2 cells treated with different Aβ42 species as measured using Western Blot after 12 h incubation. Treatment & Wash group refers to P2CSKn preincubated with cells and washed off before sAβ42 (0.5 μM) addition. g Phagocytosis of 0.5 μM sFITC-Aβ42 with or without compounds (1.0 μM) in BV2 cells, as determined using Flow cytometry. Normal group refers to sFITC-Aβ42 pretreated with P2CSKn or Pam2CSK4 for 30 min before addition to cells; Treatment & Wash group refers to P2CSKn or Pam2CSK4 preincubated with cells and washed off before sFITC-Aβ42 (0.5 μM) addition. Cells were incubated with different FITC-Aβ42 samples for 12 h. Data are representative of three independent experiments with similar results in (a, d), three independent experiments in (b, f, g), two independent experiments in (e). Data are presented as mean ± SD, n = 3 (b, f, g), n = 6 (c) independent samples using one-way ANOVA with Dunnett’s post hoc test (c, d, f) or two-tailed t tests (g). ns, not significant, *p < 0.05, **p < 0.01, ***p < 0.001, ****p < 0.0001. Exact p values were given in the Source Data file. Source data are provided as a Source Data file.
Fig. 7
Fig. 7. P2CSKn enhances Aβ phagocytosis in brains of APP/PS1 transgenic mice.
a The effect of P2CSKn or Pam2CSK4 and PBS control on Aβ, Iba1 and GFAP level in the brain of APP/PS1 transgenic mice. Compounds or PBS were mixed with Hoechst33342 (for visualizing the injection area) and injected into the cortex, respectively. Staining and/or imaging were performed using TS, OC, antibodies against Iba1 or GFAP 5d post-injection, and the stained fluorescence area in the injection site was used for calculation. b P2CSKn (right hemisphere) or RP (left hemisphere) were mixed with Alexa Fluor™ 594 (for visualizing the injection area) and injected into the hippocampus. Staining and/or imaging were performed using TS, antibodies against cleaved caspase 3, Iba1 or GFAP 5 days after injection, and the stained fluorescence intensity in the injection site and its adjacent area are used for calculation. Results were presented as injected area/adjacent area, with RP for comparison. OC, Aβ fibril specific antibody; TS, Thioflavin S; AF594, Alexa Fluor™ 594; RP, Random Peptide (Pam-KCKSKVFLKFK-ahx-nal). Data presented as mean ± SD, n = 4 (a, PBS), n = 15 (a, P2CSKn); n = 5 (a, Pam2CSK4), n = 9 (b, P2CSKn), n = 9 (b, P2CSKn) mice using one-way ANOVA with Dunnett’s post hoc test (a) or two-tailed t tests (b). ns, not significant. *p < 0.05, **p < 0.01, ***p < 0.001, ****p < 0.0001. Exact p values were given in the Source Data file. Source data are provided as a Source Data file. The mouse and mouse head schema were sourced from the SciDraw website (https://scidraw.io/). Tyler, E., & Kravitz, L. (2020). mouse. Zenodo. 10.5281/zenodo.3925901. Petrucco, L. (2020). Mouse head schema. Zenodo. 10.5281/zenodo.3925903.

Similar articles

References

    1. Iadanza, M. G., Jackson, M. P., Hewitt, E. W., Ranson, N. A. & Radford, S. E. A new era for understanding amyloid structures and disease. Nat. Rev. Mol. Cell Biol.19, 755–773 (2018). - PMC - PubMed
    1. Ke, P. C. et al. Half a century of amyloids: past, present and future. Chem. Soc. Rev.49, 5473–5509 (2020). - PMC - PubMed
    1. Chuang, E., Hori, A. M., Hesketh, C. D. & Shorter, J. Amyloid assembly and disassembly. J. Cell Sci.131, jcs189928 (2018). - PMC - PubMed
    1. Chiti, F. & Dobson, C. M. Protein misfolding, functional amyloid, and human disease. Annu. Rev. Biochem.75, 333–366 (2006). - PubMed
    1. Lashuel, H. A., Overk, C. R., Oueslati, A. & Masliah, E. The many faces of alpha-synuclein: from structure and toxicity to therapeutic target. Nat. Rev. Neurosci.14, 38–48 (2013). - PMC - PubMed

LinkOut - more resources