Differential participation of the corticospinal and corticorubral neurons during motor execution in the rat
- PMID: 40885757
- PMCID: PMC12398523
- DOI: 10.1038/s41598-025-17047-5
Differential participation of the corticospinal and corticorubral neurons during motor execution in the rat
Abstract
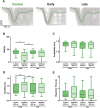
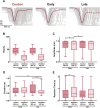
The sensorimotor cortex is crucial for learning and executing new movements with precision. It selectively modulates sensory information flow and represents motor information in a spatially organized manner. The pyramidal system is made up of layer 5 pyramidal tract neurons (PTNs), which are organized into populations with distinct morphological, genetic and functional properties. These subpopulations project to different subcortical structures in a segregated manner. To understand whether PTNs projecting to different structures play distinct functional roles in motor control, we characterized two types of layer 5 neurons in the motor cortex: corticorubral (CR) neurons, which project to the red nucleus, and corticospinal (CS) neurons, which project to the spinal cord. To analyze movement performance in rats, we compared the selective optogenetic inhibition of motor cortex CS or CR neurons during lever movement execution in response to a light stimulus. As the animals progressed through the training sessions, the variability of lever trajectories decreased, and the movements became more stereotyped. Photoinhibition of CS or CR neurons increased the performance variability of learned movements but differentially affected kinematic parameters. CR neuron inhibition affected amplitude, duration, reaction times, speed, and acceleration of the movement. In contrast, the inhibition of CS neurons mainly altered the duration and acceleration of the movement. The results indicate that the same motor order would be expected to have different causal effects when sent to different brain regions.
Keywords: Corticorubral; Corticospinal; Layer 5; Pyramidal tract neurons; Sensorimotor cortex.
© 2025. The Author(s).
Conflict of interest statement
Declarations. Competing interests: The authors declare no competing interests.
Figures


Similar articles
-
Short-Term Memory Impairment.2024 Jun 8. In: StatPearls [Internet]. Treasure Island (FL): StatPearls Publishing; 2025 Jan–. 2024 Jun 8. In: StatPearls [Internet]. Treasure Island (FL): StatPearls Publishing; 2025 Jan–. PMID: 31424720 Free Books & Documents.
-
Prescription of Controlled Substances: Benefits and Risks.2025 Jul 6. In: StatPearls [Internet]. Treasure Island (FL): StatPearls Publishing; 2025 Jan–. 2025 Jul 6. In: StatPearls [Internet]. Treasure Island (FL): StatPearls Publishing; 2025 Jan–. PMID: 30726003 Free Books & Documents.
-
Corticospinal excitability at rest outside of a task does not differ from task intertrial intervals in healthy adults.Exp Brain Res. 2024 Sep;242(9):2263-2270. doi: 10.1007/s00221-024-06895-8. Epub 2024 Jul 24. Exp Brain Res. 2024. PMID: 39043898 Free PMC article.
-
The Black Book of Psychotropic Dosing and Monitoring.Psychopharmacol Bull. 2024 Jul 8;54(3):8-59. Psychopharmacol Bull. 2024. PMID: 38993656 Free PMC article. Review.
-
Effects of action observation on corticospinal excitability: Muscle specificity, direction, and timing of the mirror response.Neuropsychologia. 2014 Nov;64:331-48. doi: 10.1016/j.neuropsychologia.2014.09.034. Epub 2014 Oct 2. Neuropsychologia. 2014. PMID: 25281883
References
-
- Isomura, Y., Harukuni, R., Takekawa, T., Aizawa, H. & Fukai, T. Microcircuitry coordination of cortical motor information in self-initiation of voluntary movements. Nat. Neurosci.12, 1586–1593 (2009). - PubMed
-
- Li, N., Chen, T. W., Guo, Z. V., Gerfen, C. R. & Svoboda, K. A motor cortex circuit for motor planning and movement. Nature519, 51–56 (2015). - PubMed
-
- Nudo, R. J. & Frost, S. B. The evolution of motor cortex and motor systems. Evol. Nerv. Syst.3, 373–395 (2007).
-
- Liang, H., Paxinos, G. & Watson, C. The red nucleus and the rubrospinal projection in the mouse. Brain Struct. Funct.217, 221–232 (2012). - PubMed
MeSH terms
Grants and funding
LinkOut - more resources
Full Text Sources
Research Materials

