. 2025 Aug 30;15(1):31955.
doi: 10.1038/s41598-025-16064-8.

Selective right heart valve remodelling in a mouse model of carcinoid disease revealed by high-resolution episcopic microscopy

Affiliations

Selective right heart valve remodelling in a mouse model of carcinoid disease revealed by high-resolution episcopic microscopy

Gaspard Suc et al. Sci Rep. .

Abstract

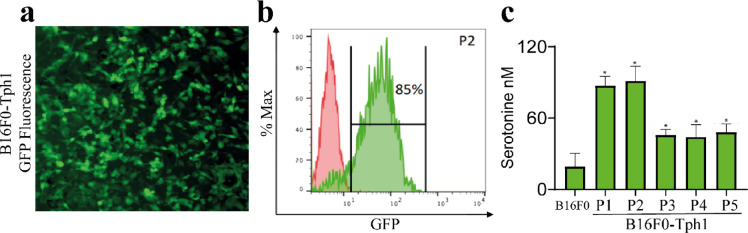
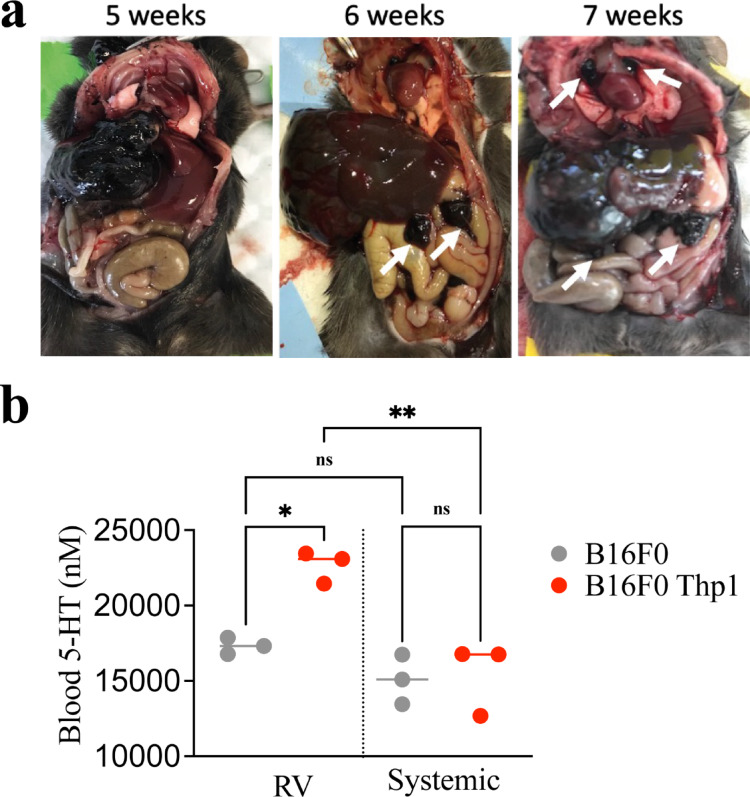
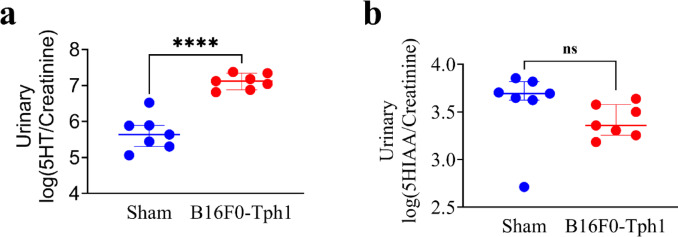
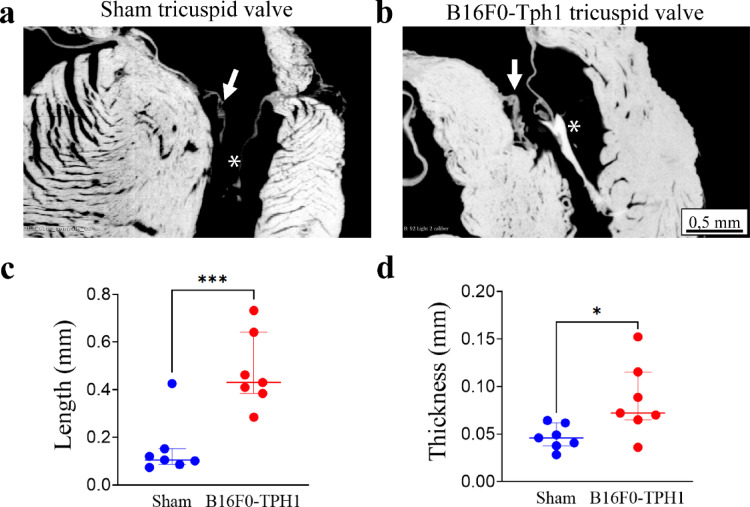
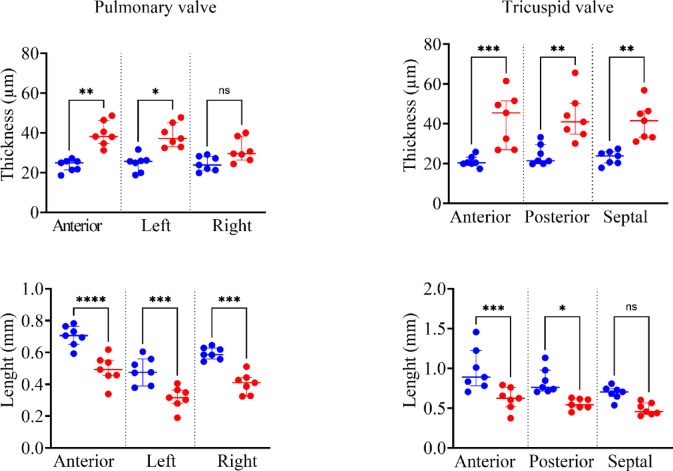
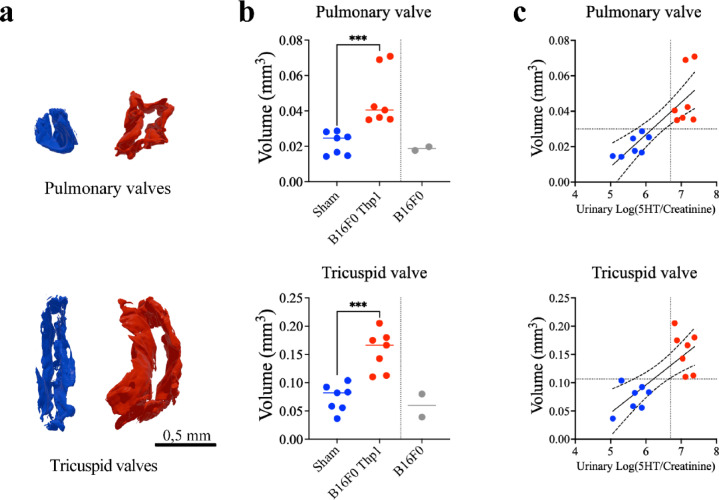
Carcinoid heart disease, a severe complication of neuroendocrine tumors, affects up to 50% of patients and is challenging to treat due to a limited understanding of its mechanisms. The disease is characterized by structural remodeling and thickening of the right heart valves, associated with elevated levels of serotonin (5-HT) released from tumor cells that have spread to the liver. Existing animal models have limitations as they either use mice with compromised immune systems or employ methods that don't consistently evaluate valve changes. We developed an improved experimental model by implanting syngeneic liver-targeted melanoma cells that were genetically engineered to produce 5-HT through the expression of the enzyme tryptophan hydroxylase type 1 (Tph1) in wild-type C57BL/6 mice. We introduced high-resolution episcopic microscopy (HREM) for comprehensive assessment of valve pathology and morphometry. Five weeks after implantation, mice exhibited increased 5-HT/creatinine urinary level ratios and HREM imaging showed selective thickening and structural remodeling of right heart valves (tricuspid and pulmonary), correlating with 5-HT/creatinine urinary level ratio, while left heart valves remained unaffected. Our data suggest that this non-immunosuppressed, right-heart valve restricted model reproduces key features of human carcinoid heart disease and, combined with HREM analysis, provides a valuable platform for studying disease mechanisms and testing potential therapies.

Keywords: Animal experimentation; Heart valves/pathology; High-resolution episcopic microscopy; Mice; Serotonin.


Conflict of interest statement

Declarations. Competing interests: The authors declare no competing interests.

Figures

Fig. 1
Fig. 1
Validation of B16F0-Tph1 cell line. (a) Representative fluorescence microscopy image showing GFP expression in B16F0-Tph1 cells. (b) Flow cytometry analysis demonstrating 85% GFP-positive cells at passage 2 (P2). Red histogram: non-modified B16F0 cells; green histogram: B16F0-Tph1 cells. (c) 5-HT concentration in culture supernatants showing sustained production in B16F0-Tph1 cells across passages (P1-P5) compared to B16F0 controls. Values represent median ± IQR from n = 3 independent experiments per condition. Statistical significance was determined using Kolmogorov–Smirnov test (*p < 0.05).
Fig. 2
Fig. 2
Macroscopic dissemination of tumor cells over time and blood 5-HT elevation in RV following intrahepatic B16F0-Tph1 implantation. (a) Representative images of mice injected with 1000 B16F0-Tph1 cells in the liver, showing progression of tumor spread at 5, 6 and 7 weeks post-injection. White arrows indicate extrahepatic dissemination (peritoneal carcinomatosis at 6 weeks and mediastinal lymph node metastases at 7 weeks). No extrahepatic dissemination was detected at 5 weeks, establishing this timepoint as optimal for the main study. (b) Blood 5-HT concentrations measured in the right ventricle (RV) and systemic circulation 5 weeks after intrahepatic implantation in B16F0-Tph1 and B16F0 mice. Data are presented as individual points with median ± IQR; n = 3 per group. Statistical significance was determined using Kolmogorov–Smirnov test (*p < 0.05 and **p < 0.01).
Fig. 3
Fig. 3
Analysis of urinary 5-HT and metabolite. (a) Log-transformed urinary serotonin (5-HT/creatinine) levels in sham (n = 7) and B16F0-Tph1 (n = 7) mice at 5 weeks post-surgery. (b) Log-transformed urinary 5-hydroxyindoleacetic acid (5-HIAA/creatinine) levels in the same groups. Data are shown as individual points with median ± IQR. Statistical significance was determined using Kolmogorov–Smirnov test (****p < 0.0001, ns: not significant).
Fig. 4
Fig. 4
Heterogeneous signal intensity distribution in pulmonary and tricuspid valves of B16F0-Tph1 mice. (a) Representative HREM images with grayscale intensity overlays (blue: low intensity; yellow: high intensity). Sham valves show uniform low-intensity signal, while B16F0-Tph1 valves exhibit spatially heterogeneous intensity patterns, with distinct high-intensity regions adjacent to low-intensity zones. (b) Normalized intensity histograms demonstrate a rightward shift in B16F0-Tph1 mice, with new high-intensity voxel populations (120–180 range) absent in sham controls. Scale bar: 0.5 mm.
Fig. 5
Fig. 5
High-resolution episcopic microscopy (HREM) analysis reveals carcinoid-induced pathology in the tricuspid valve subvalvular apparatus of B16F0-Tph1 mice. Representative HREM images of the tricuspid valve (white arrow) and associated chordae tendineae (white asterisk) in Sham (a) and B16F0-Tph1 (b) mice. Quantitative analysis shows increased chordae tendineae length (c) and thickness (d) in B16F0-Tph1 compared to Sham mice. Data are shown as individual points with median ± IQR; n = 7 per group. Statistical significance was determined using Kolmogorov–Smirnov test (***p < 0.0001, *p < 0.05, ns: not significant). Scale bar: 0.5 mm.
Fig. 6
Fig. 6
Cardiac valve thickness patterns. Valve thickness was measured at 6 equidistant points from free edge (position 1) to base (position 6) in B16F0-Tph1-treated mice (red lines) and sham controls (blue lines) in all cusps and leaflets (triangle = anterior, circle = posterior or left, inverted triangle = septal or right). Solid lines are spline curves of actual data (dotted lines). Data are presented as median ± IQR; n = 7 per group.
Fig. 7
Fig. 7
Valvular thickness and length analysis. Comparison between B16F0-Tph1 mice (red dots) and sham controls (blue dots) across different valve leaflets and cusps. Given the absence of position effect (Fig. 6), the six measurements along each leaflet/cusp were used as repeated measures. Tricuspid valve showed significant thickening across all cusps, while pulmonary valve demonstrated significant thickening in anterior and left cusps but not the right cusp. Both tricuspid and pulmonary valves showed decreased length in anterior cusps, with additional reductions in posterior (tricuspid) and left (pulmonary) cusps. Data are presented as median ± IQR; n = 7 per group. Statistical significance was determined using Kolmogorov–Smirnov test (***p < 0.0001, **p < 0.0001, *p < 0.0001, ns: not significant).
Fig. 8
Fig. 8
Volumetric analysis and correlation of cardiac valves with urinary 5-HT. (a) 3D rendering examples of measured volumes for pulmonary and tricuspid valves in sham (blue) and B16F0-Tph1 (red) mice. (b) Quantitative comparison of valve volumes showing significantly increased volumes in B16F0-Tph1 mice (n = 7) compared to sham (n = 7) and B16F0 controls (n = 2) for both pulmonary and tricuspid valves. Data are presented as median ± IQR. (c) Linear regression analysis showing the relationship between urinary log(5-HT/creatinine) and valve volume (mm3) in tricuspid valve (left) and pulmonary valve (right). Blue dots represent sham animals and red dots represent B16F0-Tph1 animals. Solid lines indicate linear regression with 95% confidence intervals (dashed lines). Dotted vertical and horizontal lines represent threshold values calculated using stepwise regression, yielding high diagnostic performance (pulmonary valve: 86% sensitivity and specificity; tricuspid valve: 100% sensitivity and specificity) for detecting pathological valve thickening. Values are presented as median ± IQR. Scale bar: 0.5 mm. Statistical significance was determined using one-way ANOVA followed by Tukey’s multiple comparisons test (***p < 0.001; ns, not significant).

References

    1. Bhattacharyya, S., Toumpanakis, C., Chilkunda, D., Caplin, M. E. & Davar, J. Risk factors for the development and progression of carcinoid heart disease. Am. J. Cardiol.107, 1221–1226 (2011). - PubMed
    1. Delhomme, C. et al. Carcinoid heart disease in patients with midgut neuroendocrine tumours. J. Neuroendocrinol.35, e13262 (2023). - PubMed
    1. Grozinsky-Glasberg, S. et al. European Neuroendocrine Tumor Society (ENETS) 2022 guidance paper for carcinoid syndrome and carcinoid heart disease. J. Neuroendocrinol.34, e13146 (2022). - PMC - PubMed
    1. Suc, G., Cachier, A., Hentic, O., Bazire, B., Sannier, A., Delhomme, C., Nataf, P., Laschet, J., Deschamps, L., Garbarz, E., Ou, P., Caligiuri, G., Iung, B., Ruszniewski, P., de Mestier, L. & Arangalage, D. Management and outcomes of carcinoid heart disease with liver metastases of midgut neuroendocrine tumours. Heart (2023). - PubMed
    1. Suc, G., Cachier, A., Hascoet, S., Arangalage, D., Iung, B. & Urena, M. Transcatheter pulmonary valve replacement for the treatment of carcinoid heart disease. Rev. Esp. Cardiol. (Engl. Ed) (2024). - PubMed

LinkOut - more resources