

Effect of natural environmental changes on Hainan migratory population with hypertension in China and related plasma metabolism features
- PMID: 40885783
- PMCID: PMC12398557
- DOI: 10.1038/s41598-025-16038-w
Effect of natural environmental changes on Hainan migratory population with hypertension in China and related plasma metabolism features
Abstract
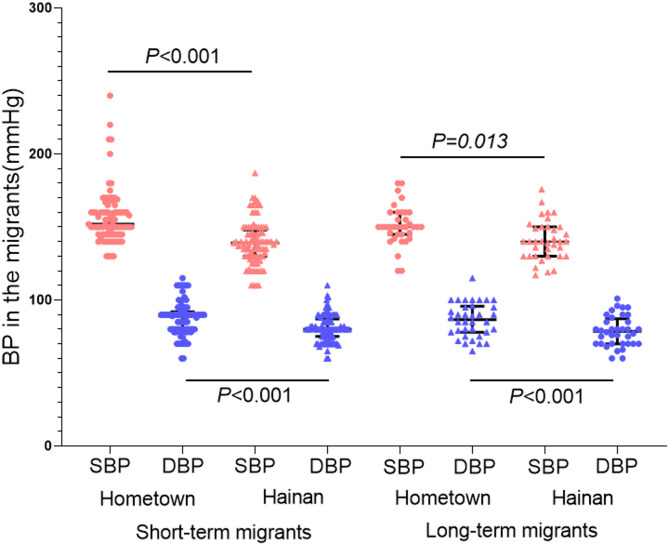
The population-based study was aimed to probe the impact of environments on migratory population. A preliminary research on the duration of Hainan and the changes of blood pressure between Hainan and hometown was carried out among 262 migratory population. Fourteen pairs of long-term migrants and short-term migrants who migrated from Northeast China were further matched. The environmental exposure was estimated with satellite-based indices, including NDVI1km,NDVI500m, EVI1km, EVI500m, PM2.5,PM10, temperature and humidity. The plasma samples were collected for untargeted metabolomics and lipidomics. The nonlinear relation represented that the differential value of blood pressure changes without taking antihypertensive drugs gradient descended and then rose accompanying with Hainan duration, and decline turning point of systolic blood pressure and diastolic blood pressure were 4.43 and 6.28 month, respectively (P for nonlinear < 0.05). Five untargeted metabolites and ten lipids were identified as differential metabolites between long-term migrants and short-term migrants, and one enriched KEGG pathway, glycerolphospholipid, was identified. The plasma PC (36:5) and LysoPE (18:1) levels were significantly positively correlated with the green space exposure (P < 0.05) in the short-term migrants, and a negative correlation was observed between the plasma 4-carboxypyrazole level and temperature in the long-term migrants (P = 0.017). Our findings illustrated that moving to Hainan for about 4-6 months was more conducive to the improvement of blood pressure before taking antihypertensive drugs on hypertensive elderly, and the difference of plasma metabolomics between short-term and long-term migrants might be related to previous environmental exposure.
Keywords: Environmental factors; Hypertension; Metabolomics; Migratory elderly.
© 2025. The Author(s).
Conflict of interest statement
Declarations. Competing interests: The authors declare no competing interests. Ethics approval and consent to participate: The study was ethically conducted in accordance with the Declaration of Helsinki. The study was approved by the Ethics Committee (No. HYLL-2020-030). All participants signed written informed consent.
Figures


Similar articles
-
Plasma metabolites associated with endometriosis in adolescents and young adults.Hum Reprod. 2025 May 1;40(5):843-854. doi: 10.1093/humrep/deaf040. Hum Reprod. 2025. PMID: 40107296
-
Gender differences in the context of interventions for improving health literacy in migrants: a qualitative evidence synthesis.Cochrane Database Syst Rev. 2024 Dec 12;12(12):CD013302. doi: 10.1002/14651858.CD013302.pub2. Cochrane Database Syst Rev. 2024. PMID: 39665382
-
Analysis of the effects of air pollutants and meteorological factors on upper respiratory tract infection outpatients in Gansu Province.Environ Sci Process Impacts. 2025 Aug 13;27(8):2564-2578. doi: 10.1039/d4em00748d. Environ Sci Process Impacts. 2025. PMID: 40686213
-
Effect of longer-term modest salt reduction on blood pressure.Cochrane Database Syst Rev. 2013 Apr 30;2013(4):CD004937. doi: 10.1002/14651858.CD004937.pub2. Cochrane Database Syst Rev. 2013. PMID: 23633321 Free PMC article.
-
Sertindole for schizophrenia.Cochrane Database Syst Rev. 2005 Jul 20;2005(3):CD001715. doi: 10.1002/14651858.CD001715.pub2. Cochrane Database Syst Rev. 2005. PMID: 16034864 Free PMC article.
References
-
- Zhang, Q., Zhang, H. & Xu, H. Health tourism destinations as therapeutic landscapes: Understanding the health perceptions of senior seasonal migrants. Soc. Sci. Med.279, 113951 (2021). - PubMed
-
- Casado-Díaz, M. A. Retiring to spain: an analysis of differences among North European nationals. J. Ethn. Migr. Stud.32, 1321–1339 (2006).
-
- Hainan provincial bureau of statistics, major indicators on population, hainan statistical year book. (2019). https://stats.hainan.gov.cn/tjj/wzss/search.html?searchWord (Accessed 31 August 2019).
MeSH terms
Grants and funding
LinkOut - more resources
Full Text Sources
Medical
