. 2025 Aug 30;16(1):8123.
doi: 10.1038/s41467-025-63531-x.

Evidence that mitochondria in macrophages are destroyed by microautophagy

Affiliations

Evidence that mitochondria in macrophages are destroyed by microautophagy

Shiou-Ling Lu et al. Nat Commun. .

Abstract

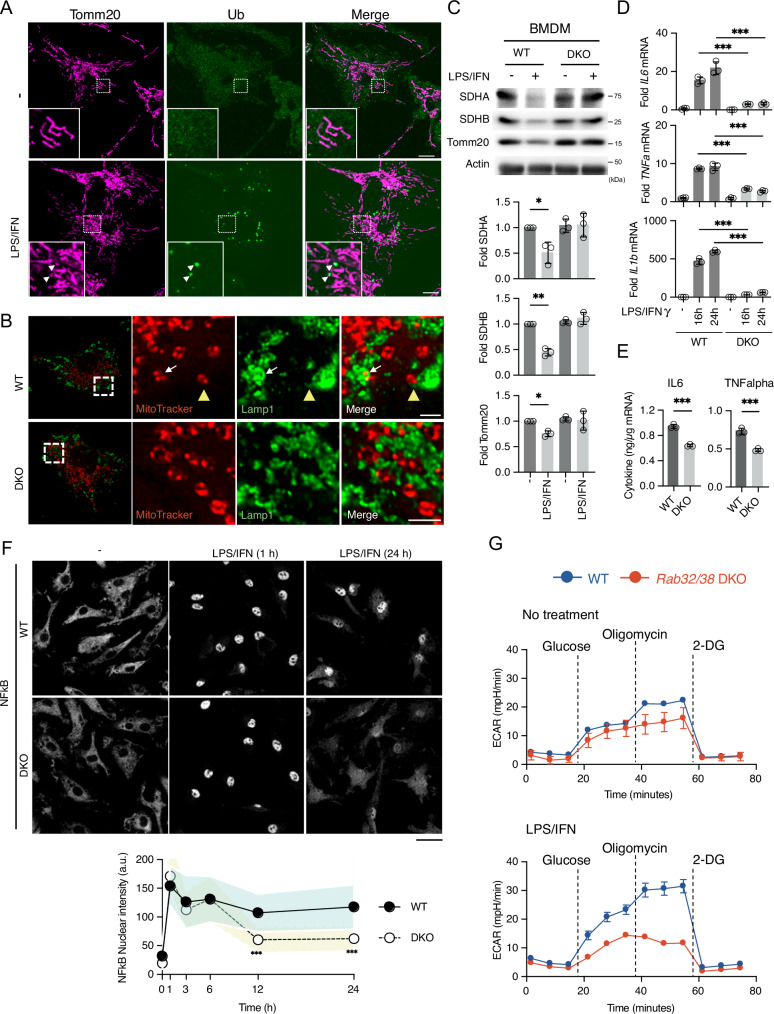
Microautophagy is an intracellular degradation process in which degradatory organelles, such as the lysosome, directly take up substrates by invagination and/or protrusion of their membranes. Here, we provide evidence that Rab32-positive, lysosome-related organelles in macrophages incorporate various other organelles, including endosomes and mitochondria. Our data indicates that, upon exposure to a mitochondria-damaging reagent, mitochondria can be directly engulfed by the lysosome-like organelles independently of macroautophagy or ESCRT machinery. Rab32 GTPase, phosphatidylinositol 3,5-bisphosphates, ubiquitination, and p62/SQSTM1 are crucial for this degradation. Furthermore, the degree of M1 polarization of macrophages, which is facilitated by metabolic reprogramming into increased glycolysis via mitochondrial elimination, is significantly reduced in Rab32/38 double-knockout macrophages. Thus, microautophagy plays a role in the physiological regulation of macrophages.


Conflict of interest statement

Competing interests: The authors declare no competing interests.

Figures

Fig. 1
Fig. 1. Endosomes are incorporated into Rab32-positive LROs in macrophages.
A BMDMs (Bone marrow-derived macrophage) stably expressing Strawberry-Rab5A (Str-Rab5A) or Strawberry-Rab7 (Str-Rab7) were fixed and stained with a Rab32 antibody and observed using confocal fluorescence microscopy. This experiment was repeated twice. Scale bar: 10 μm. B BMDMs expressing GFP-Rab32 and Str-Rab5A were treated with bafilomycin A1 (50 nM) for 24 h. After fixation, organelles exhibiting fluorescence were analyzed using confocal fluorescence microscopy. The targeted regions were further examined by CLEM. Green arrows indicate Rab32-positive organelles, red arrows indicate Str-Rab5A-positive internal structures, white arrows indicate Rab32-engulfed structures, and yellow arrows indicate the investigation structure. Two cells were observed. Scale bar: 5 μm (IF), 2 μm (EM).
Fig. 2
Fig. 2. Evidence for mitophagy in Rab32-positive LRO in macrophages.
A BMDMs were treated with or without OA for 6 h and then fixed for immunostaining with anti-Rab32 and anti-Tomm20 antibodies. Scale bars: 5 μm (left), 2 μm (insets). Arrows indicate mitochondria-containing Rab32-LRO. B BMDMs isolated from WT and Rab32/Rab38 DKO mice were stained with Mtphagy Dye and treated with OA for 3 h. The cells were observed using confocal microscopy. Scale bar: 10 μm. C The fluorescence signal intensities of Mtphagy Dye in WT and DKO BMDMs from (B) were quantified using ImageJ. Each dot represents a measurement from an individual cell. A.U. denotes arbitrary units. Data are presented as mean values ± SD. Similar experiments were performed more than three times, and a representative result is shown. D WT, Atg7 KO, or Fip200 KO RAW264.7 cells stably expressing GFP-Rab32 were stained with Mtphagy Dye and treated with or without OA for 3 h. Live cells were observed using confocal microscopy. Scale bars: 5 μm (left), 2 μm (insets). E The fluorescence intensity of Mtphagy Dye in the three groups was quantified from (D) using ImageJ. Each dot represents the fluorescence intensity of an individual cell. The experiment was performed twice, and a representative result is shown. Data are presented as mean values ± SD. F Lamp1-GFP-expressing WT, Atg7 KO, Fip200 KO, or Rab32 KO RAW264.7 cells were stained with MitoTracker and treated with OA and bafilomycin A1 for 3 h. Live cells were then observed using confocal microscopy. Scale bars: 5 μm (left) and 2 μm (right). G WT, Atg7 KO, or Rab32 KO RAW264.7 cells were treated with OA in combination with the anti-apoptotic drug z-VAD for 24 h. Cells were then collected for Western blot analysis to detect SDHA, SDHB, and Tomm20 protein levels. Quantitative data were collected from four independent experiments. Data are presented as mean values ± SD. Statistical significance was analyzed using an unpaired two-tailed t-test for (C) and (E) and a paired two-tailed t-test for (G). (*p < 0.05; **p < 0.01; ***p < 0.001; ****p < 0.0001).
Fig. 3
Fig. 3. Evidence for direct engulfment of mitochondria by Rab32-LRO in macrophages.
A RAW264.7 cells stably expressing GFP-Rab32 and Lamp1-RFP were observed by confocal microscopy without fixation. Yellow arrowheads indicate invagination sites. This experiment is repeated three times. Scale bar: 5 μm. B GFP-Rab32-expressing Atg7 KO RAW264.7 cells were stained with MitoTracker and then with OA for 1.5 h. This experiment is repeated three times. Scale bar: 2 μm. C WT RAW264.7 cells expressing GFP-Rab32 were stained with MitoTracker and treated with CCCP for 1.5 h. After fixation, cells were observed using confocal microscopy and further analyzed by electron microscopy. Yellow arrows indicate mitochondria stained with MitoTracker. The two arrows on the far-left highlight mitochondria in close association with invaginated membranes. Yellow arrowheads indicate the MitoTracker-positive bodies inside Rab32-LROs, which exhibited poorly defined cristae, suggesting potential damage induced by OA treatment. Total 22 cells were observed. D RAW264.7 cells expressing GFP-Rab32 WT, Q83L (active form), or T37N (inactive form) were analyzed using confocal microscopy. White arrows indicate invaginated membrane structures positive for LRO. Quantitative data represent the percentage of invagination-positive Rab32-LROs per cell. Any GFP-Rab32 signal detected inside the GFP-Rab32 limiting membrane was classified as an invaginating structure. More than 30 cells per group were analyzed in a blinded manner. No Rab32-ring-like structures were observed in GFP-Rab32TN-expressing cells. The experiments were performed twice, and a representative result is presented. ND: not detectable. Scale bar: 5 μm. Statistical significance was analyzed using an unpaired t-test (****p < 0.0001). E RAW264.7 cells expressing GFP-Rab32 WT or QL were treated with or without Apilimod (AP) for 2 h. This experiment is repeated three times. Scale bar: 2 μm. F GFP-Rab32QL-expressing RAW264.7 cells were stained with MitoTracker and treated with Apilimod (AP) for 30 min followed by washout for 1 or 3 h. After 1-h of washout, cells were treated with OA for the indicated periods, with or without bafilomycin A1. This experiment is repeated three times. Scale bar: 2 μm. G GFP-Rab32QL-expressing Atg7 KO RAW264.7 cells were stained with MitoTracker and treated with Apilimod for 30 min, followed by a 1 h washout. After the washout, cells were treated with OA for 3 h. Time-lapse imaging was performed using confocal super-resolution microscopy (SpinSR10) for 10 min, with an 80 s interval between frames.
Fig. 4
Fig. 4. Mitochondria are ubiquitinated during Rab32-LRO-mediated mitophagy.
A BMDMs were treated with OA for 6 h. Following treatment, cells were fixed, stained with anti-Tomm20 and anti-ubiquitin antibodies. White arrowheads indicate ubiquitin-positive mitochondria. Scale bar: 10 μm. Each data point represents the number of ubiquitin signals per image, normalized to the number of cells. N = 5 images for “-” and 15 images for “OA”. Images were analyzed using the ImageJ ‘Find Maxima’ tool, applying a defined threshold in a blinded manner. The experiments were performed twice, and a representative result is presented. Data are presented as mean values ± SD. B WT or DKO BMDMs were treated and analyzed as in (A). Scale bar: 5 μm. Each point represents the number of ubiquitin signals per image, normalized to the number of cells. N = 4 images for each group. The experiments were performed twice, and a representative result is presented. Data are presented as mean values ± SD. C Atg7 KO or Fip200 KO RAW264.7 cells expressing GFP-Rab32 were pre-stained with MitoTracker and treated with OA and bafilomycin A1, with or without TAK243 (5 μM) for 3 h. Each dot represents the fluorescence intensity of MitoTraker inside Rab32 rings (N = 199, 196, 230, 203 rings from left to right), measured using ImageJ. Similar experiments were conducted at least twice, and a representative result is shown. Box plots indicate the median (center line), the interquartile range (box), and the range (whiskers). D Atg7 KO RAW264.7 cells expressing GFP-Rab32WT or QL were treated with the same condition in Fig. 3F, with or without TAK243 for 1.5 h. White arrows indicate the MitoTracker positive signal engulfed into Rab32-LRO. E Atg7 KO RAW264.7 cells expressing GFP-Rab32 were stained with MitoTracker and then treated with OA and bafilomycin A1 with or without TAK243 for 3 h. After fixation, cells were stained with the anti-p62 antibody. Yellow arrows indicate p62-positive mitochondria inside Rab32-LRO. White arrowheads indicate p62-positive mitochondria associated with Rab32-LRO. Scale bar: 5 μm (upper), 2 μm (bottom). F Scramble control or p62 knockdown (KD) WT or Atg7 KO RAW264.7 cells were transduced with GFP-Rab32 using a retrovirus. After 24 h of transduction, cells were stained with MitoTracker and treated with OA and bafilomycin A1 for 3 h. Scale bar: 2 μm. The percentage of MitoTracker-positive Rab32-LROs per cell was quantified. N = 20, 20, 18, 19 cells from left to right. The experiments were performed twice, and a representative result is presented. Data are presented as mean values ± SD. Statistical significance was analyzed using an unpaired two-tailed t-test (***p < 0.001; ****p < 0.0001).
Fig. 5
Fig. 5. M1 polarization is defective in Rab32/Rab38 DKO macrophages.
A BMDMs were treated with LPS/IFN-γ for 6 h, stained with anti-Tomm20 and anti-ubiquitin antibodies, and observed by confocal microscopy. White arrowheads indicate ubiquitin-positive mitochondria. Scale bar: 10 μm. B WT and DKO BMDM cells were stained with MitoTracker and treated as described in (A). Cells were then fixed and stained with anti-Lamp1 antibody. White arrows indicate mitochondria-containing lysosomes. Yellow arrowheads mark fragmented mitochondria undergoing uptake by LRO. Scale bar: 2 μm. C WT or DKO BMDMs treated with or without LPS/IFN-γ for 24 h were subjected to Western blot analysis. Quantitative data were collected from three independent experiments. Data are presented as mean values ± SD. D, E WT or DKO BMDMs were treated with LPS/IFN-γ for 16 or 24 h. Cells were analyzed by qPCR (D), and culture media were analyzed using ELISA (E). ELISA data were normalized to total RNA levels. The experiments were repeated at least three times, and representative data are shown from a technical triplicate. Data are presented as mean values ± SD. F WT or DKO BMDMs were treated with LPS/IFN-γ for the indicated periods, fixed, and stained with anti-NFκB antibody and DAPI (not shown). Cells were observed using confocal microscopy. Scale bar: 10 μm. Quantitative data represent the mean signal intensity of NF-κB in the nucleus per cell among more than 400 cells measured by ImageJ. The blue and yellow background areas indicate standard deviation (SD) ranges. The experiments were performed twice, and representative data are shown. G WT or DKO BMDMs were treated with or without LPS/IFN-γ for 24 h, and the extracellular acidification rate (ECAR) was measured using the Seahorse XF Analyzer. The experiments were performed three times, and representative data are shown from a technical triplicate. Data are presented as mean values ± SD. Statistical significance was analyzed using a paired t-test for (C) and an unpaired two-tailed t-test for (D, E) and (F) (*p < 0.05; **p < 0.01; ***p < 0.001; ****p < 0.0001).

References

    1. Ohsumi, Y. Historical landmarks of autophagy research. Cell Res24, 9–23 (2014). - PMC - PubMed
    1. Klionsky, D. J. et al. Autophagy in major human diseases. EMBO J.40, e108863 (2021). - PMC - PubMed
    1. Oku, M. & Sakai, Y. Three distinct types of microautophagy based on membrane dynamics and molecular machineries. BioEssays40, e1800008 (2018). - PubMed
    1. Mijaljica, D., Prescott, M. & Devenish, R. J. Microautophagy in mammalian cells: revisiting a 40-year-old conundrum. Autophagy7, 673–682 (2011). - PubMed
    1. Klionsky, D. J. & Eskelinen, E.-L. The vacuole vs. the lysosome: when size matters. Autophagy10, 185–187 (2014). - PMC - PubMed

LinkOut - more resources