. 2025 Aug 30;8(1):1317.
doi: 10.1038/s42003-025-08759-5.

Stage-specific requirement for METTL3-dependent m6A epitranscriptomic regulation during myogenesis

Affiliations

Stage-specific requirement for METTL3-dependent m6A epitranscriptomic regulation during myogenesis

Ye-Ya Tan et al. Commun Biol. .

Abstract

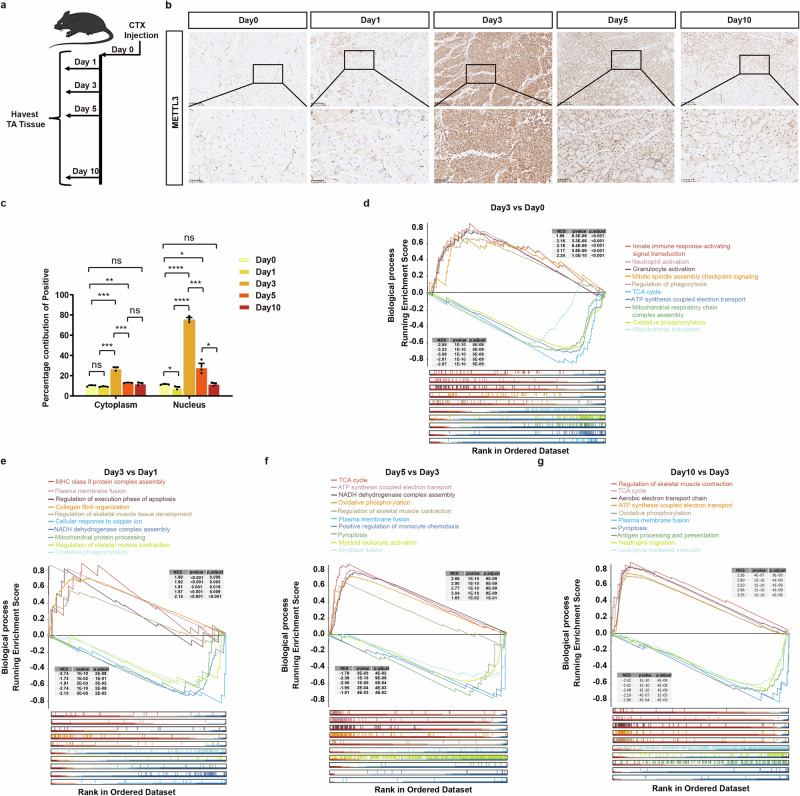
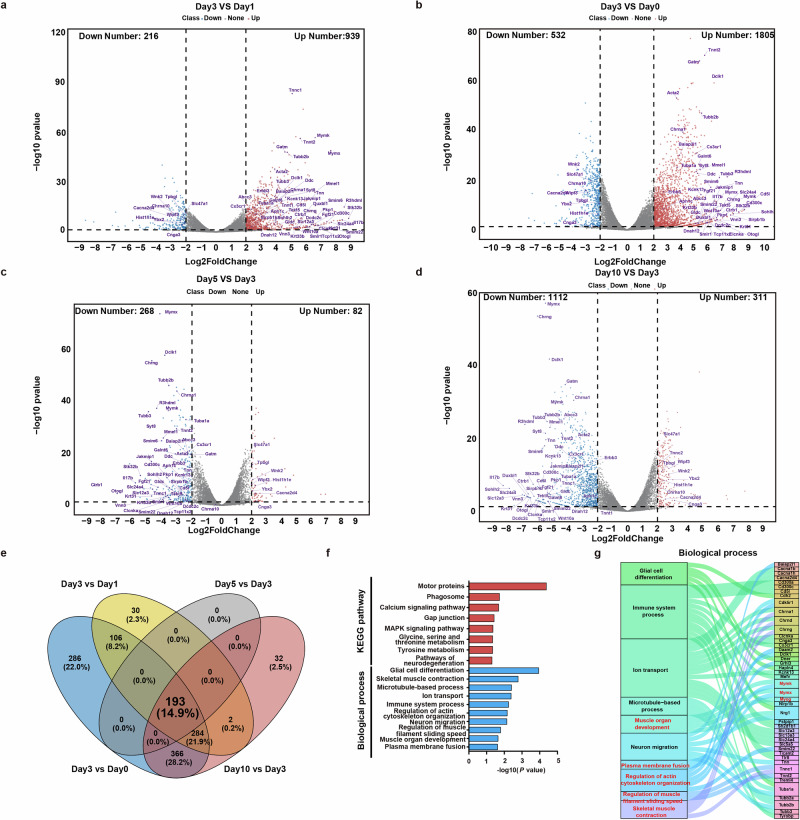
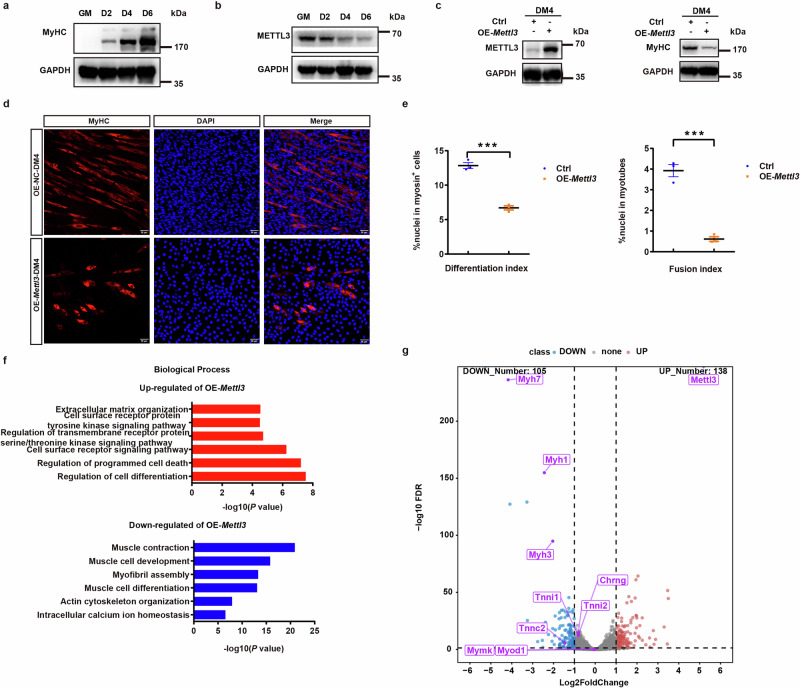
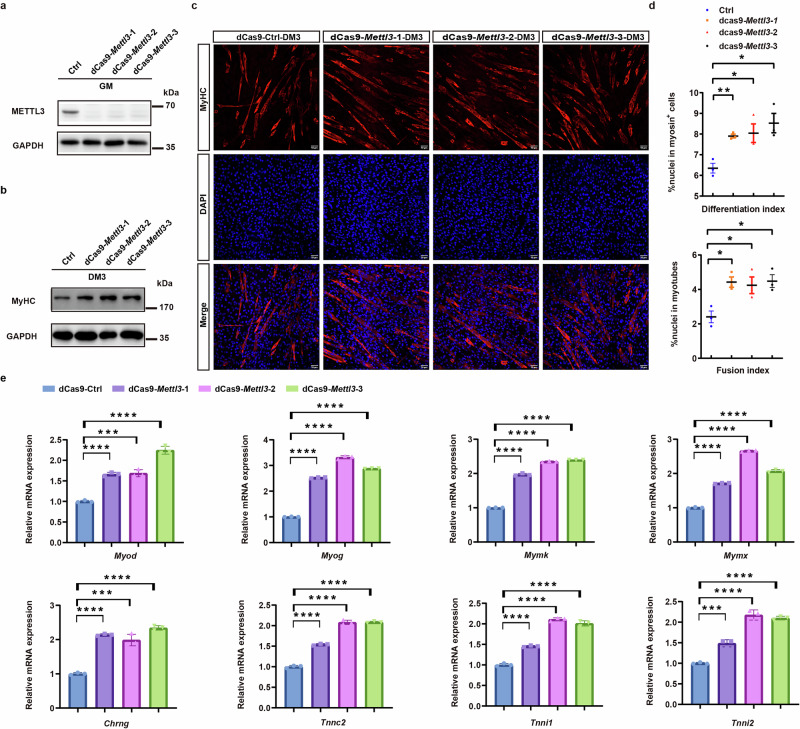
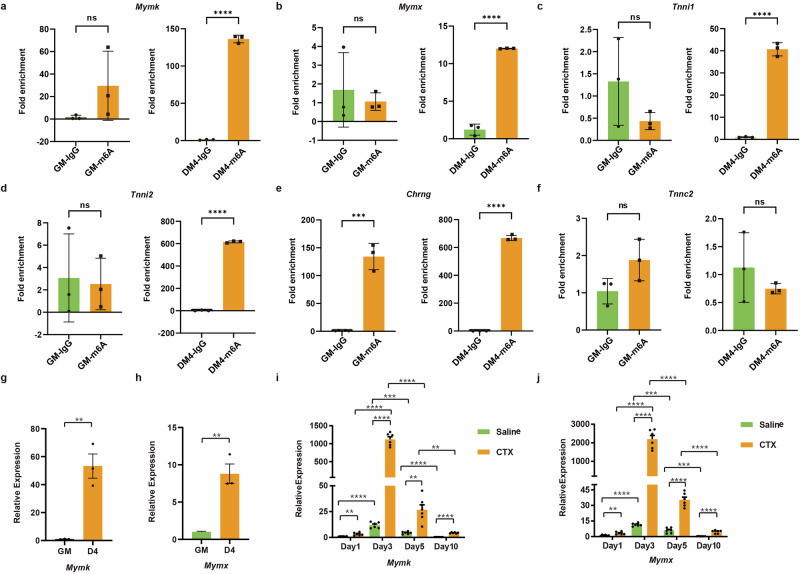
The regulatory role of N6-methyladenosine (m6A) modification in skeletal muscle myogenesis and muscle homeostasis remains poorly characterized, particularly regarding the functional significance of methyltransferase-like 3 (METTL3), the catalytic subunit of the m6A methyltransferase complex (MTC), in myogenic regulation. Through systematic investigation of m6A epitranscriptomic remodeling during myogenesis, we demonstrate that METTL3-mediated m6As orchestrates myoblast fusion processes in both differentiation and regeneration contexts. Notably, we observed marked induction of Mettl3 expression post-injury, accompanied by substantial transcriptomic alterations in myogenesis-related pathways. High-resolution m6A mapping revealed distinct dynamic patterns of METTL3-regulated m6As during differentiation, exhibiting dichotomous regulation across target transcripts. Mechanistically, we identified myogenic fusion factors Mymx and Mymk as direct targets of METTL3, showing concomitant upregulation of both transcript abundance and m6A deposition during myogenesis. This study provides comprehensive multi-omics resources delineating the mechanistic landscape of METTL3-regulated m6As in myogenic programming, establishing METTL3 as a critical regulatory node governing myoblast fusion dynamic.


Conflict of interest statement

Competing interests: The authors declare no competing interests.

Figures

Fig. 1
Fig. 1. Identification and integrative analysis of DEGs during skeletal muscle regeneration.
a Timeline characterizing the skeletal muscle repair model. b Representative immunohistochemistry of METTL3 from TA muscles at 1-, 3-, 5-, and 10-days following CTX-induced skeletal muscle injury (n = 3). Scale bars, 100 μm. c Quantification of anti-METTL3 staining intensity in immunohistochemistry from panel (b). d GSEA analysis on the entire set of DEGs between the third day post-injury and pre-injury conditions. e GSEA analysis on the entire set of DEGs between the first- and third-day post-injury. f GSEA analysis on the entire set of DEGs between day 3 and day 5 post-injury. g GSEA analysis on the entire set of DEGs between day 3 and day 10 post-injury. Data presented as means ± SEM. ns. not significant, *P < 0.05, **P < 0.01, and ***P < 0.001, by two-sided Student’s t test.
Fig. 2
Fig. 2. Comparative analysis of gene expression levels on the third day post-injury relative to those at other time points.
a Volcano plot of DEGs between the first- and third-day post-injury. b Volcano plot of DEGs between the third day post-injury and pre-injury conditions. c Volcano plot of DEGs between day 3 and day 5 post-injury. d Volcano plot of DEGs between day 3 and day 10 post-injury. e Venn diagram showing the proportion of DEGs between the four comparison groups. f KEGG and GO analysis of intersection of the overlapping genes. g The Sankey map illustrates the GO pathway of TOP genes enrichment.
Fig. 3
Fig. 3. The impact of Mettl3 overexpression on myoblast differentiation and fusion.
a Immunoblotting analysis of MyHC during myoblasts differentiation. b Immunoblotting analysis of METTL3 during myoblasts differentiation. c Immunoblotting analysis of METTL3 and MyHC in Mettl3-overexpressing cells and GFP-overexpressing cells. GFP-overexpressing cells were used as negative controls. d Representative immunofluorescent staining of Mettl3 overexpressed cells and wildtype cells on the fourth day post-differentiation (n = 3). Red indicated MyHC; blue indicated DAPI staining of nuclei. The merged images were shown. Scale bars, 50 μm. e Differentiation index was quantified from representative immunofluorescent images. The differentiation index is defined as the percentage of MyHC-positive cells relative to the total number of nuclei. The fusion index is defined as the ratio of the number of myotubes, characterized by MyHC-positive cells containing at least two nuclei, to the total number of nuclei in the field. f GO analysis of DEGs (up-regulated or down-regulated) in Mettl3-overexpressing cells. g Volcano plot of DEGs between Mettl3-overexpressing cells and GFP-overexpressing cells on the fourth day post-differentiation. Data presented as means ± SEM. ns., not significant, *P < 0.05, **P < 0.01, and ***P < 0.001, by two-sided Student’s t test, GAPDH was used as the internal control.
Fig. 4
Fig. 4. Inhibition of Mettl3 expression affected the expression of genes related to myoblast fusion.
a Immunoblotting analysis demonstrating METTL3 expression in Mettl3 knockdown cells compared to the control group. b Immunoblotting analysis demonstrating MyHC expression in Mettl3 knockdown cells compared to the control group. c Representative immunofluorescent staining of Mettl3 knockdown cells compared to the control group on the third day post-differentiation (n = 3). Red indicated MyHC; blue indicated DAPI staining of nuclei. The merged images were shown. Scale bars, 50 μm. d Differentiation index was quantified from representative immunofluorescent images. The differentiation index is defined as the percentage of MyHC-positive cells relative to the total number of nuclei. The fusion index is defined as the ratio of the number of myotubes, characterized by MyHC-positive cells containing at least two nuclei, to the total number of nuclei in the field. e RT-qPCR analysis showing the expression levels of genes associated with myoblast fusion in Mettl3 knockdown cells relative to the control group on the third day post-differentiation. Data presented as means ± SEM. ns. not significant, *P < 0.05, **P < 0.01, and ***P < 0.001, by two-sided Student’s t test, GAPDH was used as the internal control.
Fig. 5
Fig. 5. m6A profiles in Mettl3-overexpressing myoblasts during differentiation.
a Schematic of the phenotypic analysis and m6A-seq procedure. b Venn diagram of peaks enriched in GFP-overexpressing cells and Mettl3-overexpressing cells. c GO analysis of genes encoding mRNAs with common m6As in GFP-overexpressing cells during differentiation. d GO analysis of genes encoding mRNAs with common m6As in Mettl3-overexpressing cells and GFP-overexpressing cells at GM stages. e GO analysis of genes encoding mRNAs with common m6As in Mettl3-overexpressing cells and GFP-overexpressing cells on the fourth day post-differentiation. f GO analysis of genes encoding mRNAs with specific m6As in GFP-overexpressing cells during differentiation. g GO analysis of genes encoding mRNAs with specific m6As in Mettl3-overexpressing cells and GFP-overexpressing cells prior to differentiation induction. h GO analysis of genes encoding mRNAs with specific m6As in Mettl3-overexpressing cells and GFP-overexpressing cells on the fourth day post-differentiation.
Fig. 6
Fig. 6. Features of METTL3 regulated lncRNA m6A alterations during differentiation.
a Venn diagram of lncRNA peaks enriched in GFP-overexpressing cells and Mettl3-overexpressing cells. b Metagene profiles of enrichment of all m6A peaks across lncRNAs transcriptome in Mettl3-overexpressing cells and GFP-overexpressing cells before and after induced differentiation. c Pie charts represent the proportion of m6A peaks in the three regions of lncRNAs before and after induced differentiation. d Histogram represents the relative enrichment of m6A peaks in the three regions of lncRNAs before and after induced differentiation.
Fig. 7
Fig. 7. METTL3 regulates skeletal muscle fusion in an m6A-dependent manner.
a Venn diagram showing the number of overlapping DEGs between the four comparison groups during skeletal muscle regeneration (big circles) and the number of differentially expressed transcripts that also contain m6As in Mettl3-overexpressing cells and GFP-overexpressing cells before and after induced differentiation (small circles). b Heatmap of differentially expressed transcripts with m6As in Mettl3-overexpressing cells on the fourth day post-differentiation. c Heatmap of differentially expressed transcripts with m6As in Mettl3-overexpressing cells prior to differentiation induction. d Integrative Genomics View (IGV) of input and immunoprecipitation overlays on the Mymk gene from the MeRIP-seq data set for Mettl3-overexpressing cells and GFP-overexpressing cells before and after induced differentiation. e IGV of input and immunoprecipitation overlays on the Mymx gene from the MeRIP-seq data set for Mettl3-overexpressing cells and GFP-overexpressing cells before and after induced differentiation. f IGV of input and immunoprecipitation overlays on the Tnni1 gene from the MeRIP-seq data set for Mettl3-overexpressing cells and GFP-overexpressing cells before and after induced differentiation. g IGV of input and immunoprecipitation overlays on the Tnni2 gene from the MeRIP-seq data set for Mettl3-overexpressing cells and GFP-overexpressing cells before and after induced differentiation. h IGV of input and immunoprecipitation overlays on the Tnnc2 gene from the MeRIP-seq data set for Mettl3-overexpressing cells and GFP-overexpressing cells before and after induced differentiation. i IGV of input and immunoprecipitation overlays on the Chrng gene from the MeRIP-seq data set for Mettl3-overexpressing cells and GFP-overexpressing cells before and after induced differentiation.
Fig. 8
Fig. 8. Methylated RIP–qPCR analysis to examine m6A and expression levels of mRNAs with METTL3-regulated m6As.
a RT-qPCR analysis of Mymk expression in immunoprecipitated RNAs during differentiation. b RT-qPCR analysis of Mymx expression in immunoprecipitated RNAs during differentiation. c RT-qPCR analysis of Tnni1 expression in immunoprecipitated RNAs during differentiation. d RT-qPCR analysis of Tnni2 expression in immunoprecipitated RNAs during differentiation. e RT-qPCR analysis of Chrng expression in immunoprecipitated RNAs during differentiation. f RT-qPCR analysis of Tnnc2 expression in immunoprecipitated RNAs during differentiation. IgG Immunoprecipitation was used as negative control. g RT-qPCR analysis of Mymk expression during myoblasts differentiation. h RT-qPCR analysis of Mymx expression during myoblasts differentiation. i RT-qPCR analysis of Mymk expression from TA muscles at 1-, 3-, 5- and 10-days following CTX-induced skeletal muscle injury. j RT-qPCR analysis of Mymx expression from TA muscles at 1-, 3-, 5- and 10-days following CTX-induced skeletal muscle injury. Data presented as means ± SEM. ns. not significant, *P < 0.05, **P < 0.01, and ***P < 0.001, by two-sided Student’s t test.

Similar articles

References

    1. Castro-Hernandez, R. et al. Conserved reduction of m(6)A RNA modifications during aging and neurodegeneration is linked to changes in synaptic transcripts. Proc. Natl. Acad. Sci. USA120, e2204933120 (2023). - PMC - PubMed
    1. Liu, Y. et al. N6-methyladenosine-mediated gene regulation and therapeutic implications. Trends Mol. Med. 29, 454–467 (2023). - PubMed
    1. He, P. C. & He, C. m(6) A RNA methylation: From mechanisms to therapeutic potential. EMBO J.40, e105977 (2021). - PMC - PubMed
    1. Huang, H., Weng, H. & Chen, J. The biogenesis and precise control of RNA m(6)A methylation. Trends Genet36, 44–52 (2020). - PMC - PubMed
    1. Wang, X. et al. Structural basis of N(6)-adenosine methylation by the METTL3-METTL14 complex. Nature534, 575–578 (2016). - PubMed

LinkOut - more resources