. 2025 Aug 30;44(1):261.
doi: 10.1186/s13046-025-03506-4.

E2F1-autophagy-ALDH1A1 axis enhances self-renewal and drug resistance of lung cancer stem-like cells in a p53-dependent manner

Affiliations

E2F1-autophagy-ALDH1A1 axis enhances self-renewal and drug resistance of lung cancer stem-like cells in a p53-dependent manner

Jingyuan Li et al. J Exp Clin Cancer Res. .

Abstract

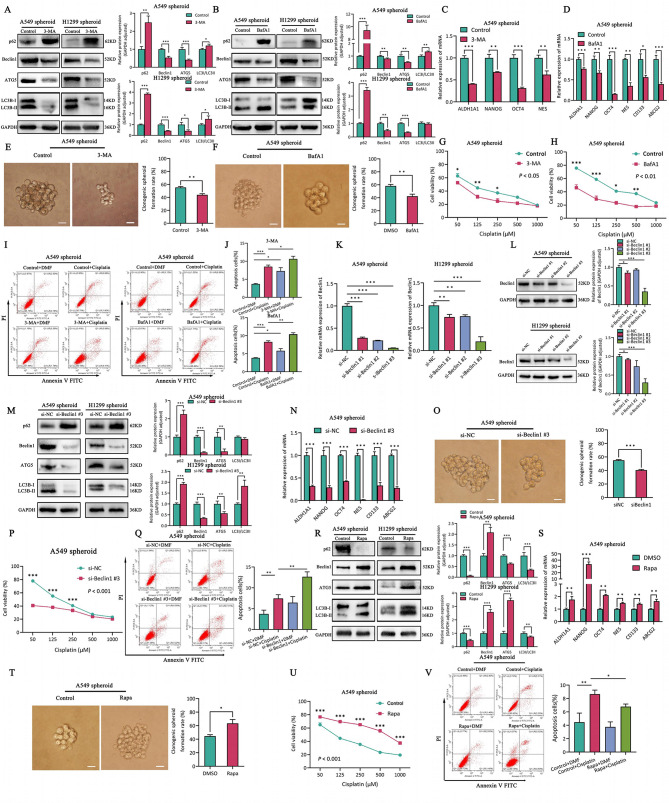
Lung adenocarcinoma (LUAD) is a predominant subtype of non-small cell lung adenocarcinoma (NSCLC). It is typically asymptomatic and associated with high mortality rates. Despite recent advancements in screening technologies and therapeutic approaches, its pathogenesis still remains elusive. Therefore, it is imperative to explore new diagnostic markers and therapeutic targets for LUAD management. Cancer stem cells (CSCs) have high self-renewal capacity and incur therapeutic resistance, thus, considered as crucial elements in initiating and promoting tumor development. Contextual to this, the present study reveals the role of the transcriptional activator E2F1 in LUAD oncogenesis and its association with various biological characteristics of lung cancer stem cells (LCSCs). Whereby, it may also serve as a crucial factor in regulating autophagy. Autophagy can modulate stemness by either promoting or inhibiting CSCs characteristics. Pertinently, our study integrated bioinformatics, in-vitro and in-vivo experiments to elucidate that E2F1 can induce ALDH1A1 through autophagy, thus promoting self-renewal and drug resistance of LCSCs, as well as tumorigenicity. Mechanistically, "E2F1-autophagy-ALDH1A1" axis enhanced the self-renewal capacity and drug resistance of LCSCs in a p53-dependent manner, highlighting the potential of E2F1 as a promising marker for LUAD.

Keywords: Autophagy; Drug resistance; E2F1; Lung cancer stem cells; Self-renewal; p53.


Conflict of interest statement

Declarations. Ethics approval and consent to participate: All animal experiments were approved and licensed by the Animal Ethics Committee of Southwest Medical University (NO. 20211121-003). This study was approved by the Institutional Review Board of the Affiliated Hospital of Southwest Medical University (NO.KY2024460), and informed consent was waived due to the retrospective nature of the research. Consent for publication: All authors confirm their consent to publish this manuscript. Competing interests: The authors declare no competing interests.

Figures

Fig. 1
Fig. 1
Lung cancer stem cells exhibit high stemness, drug resistance, and autophagic fluxes. (A) The morphology of LUAD parental and spheroid cells, scale bar = 30 μm. (B) Expression of stem genes in parental and spheroid cells of LUAD by RT-qPCR, TBP as the internal control. (C) Flow cytometry analysis of ALDH1A1 expression in LUAD parental and spheroid cells. The Right panel represents quantification of ALDH1A1 expression. (D) Spheroid formation in LUAD parental and spheroid cells by single clone assay. The Right panel represents quantification of single clone assay. (E) Proliferation activities of LUAD parental and spheroid cells incubated with cisplatin by CCK8. (F) The effect of cisplatin on apoptosis in LUAD parental and spheroid cells by flow cytometry. The Right panel represents quantification of apoptosis cells. (G) Tumor bearing nude mice were inoculated with LUAD parental and spheroid cells (1 × 104 cells), respectively. H-I. Tumor growth curves of LUAD parental and spheroid cells in nude mice. (H) Tumor volume. (I) Tumor weight. (J) The mRNA expression of autophagy related genes in parental and spheroid cells of LUAD by RT-qPCR, TBP as the internal control. K. The protein levels of p62, Beclin1, ATG5, LC3B in LUAD parental and spheroid cells assessed by Western blotting, GAPDH protein was used as the internal control. The Right panel represents quantification. L. Immunofluorescent staining of LC3B protein in LUAD parental and spheroid cells, scale bar = 30 μm. The Right panel represents quantification of fluorescence expression. M. LUAD parental and spheroid cells were transfected with GFP-mRFP-LC3 to analyze LC3 puncta by confocal microscope, scale bar = 30 μm. The Right panel represents quantification of autophagic flux intensity. N. Transmission electron microscopy analyzed the amount of autophagic structures (indicated by red arrow), scale bar = 2 μm (upper panels), scale bar = 500 nm (lower panels). The Right panel represents quantification of autophagic structures. *P < 0.05, **P < 0.01, ***P < 0.001
Fig. 2
Fig. 2
Autophagy enhances self-renewal and drug resistance of lung cancer stem cells. A-B. The levels of autophagy related protein in LUAD spheroid cells incubated with autophagy inhibitor 3-MA (A) or autophagy inhibitor BafA1 (B) compared with the control cells, GAPDH protein was used as the internal control. The Right panel represents quantification. C-D. The expression of CSCs marker in LUAD spheroid cells incubated with 3-MA (C) or BafA1 (D) compared with the control cells, TBP as the internal control. E-F. Spheroid formation in LUAD parental and spheroid cells incubated with autophagy inhibitor 3-MA (E) or BafA1 (F) and control by single clone assay. The Right panel represents quantification of single clone assay. G-H. The cell viability of LUAD spheroid cells incubated with 3-MA (G) or BafA1 (H) and control cells was detected by CCK8 assay. I-J. Flow cytometric analysis of apoptosis in A549 spheroids treated with cisplatin, with or without the addition of 3-MA or BafA1. Cells were stained with Annexin V-FITC and propidium iodide (PI) to assess apoptosis (I). The Right panel represents quantification of apoptosis cells (J). K-L. The expression of Beclin1 in si-NC and si-Beclin1 of LUAD spheroid cells, si-NC was the negative control, si-Beclin1 knocked down Beclin1 by transfecting with siRNA. K. RT-qPCR. L. Western blotting, The Right panel represents quantification. M. Autophagy relative protein abundance in si-NC and si-Beclin1 of LUAD spheroid cells. The Right panel represents quantification. N-O. The self-renewal capability of si-NC and si-Beclin1 LUAD spheroid cells. N. mRNA abundance of stemness genes. O. Single clone assay. The Right panel represents quantification of single clone assay. P-Q. The therapy resistance of si-NC and si-Beclin1 LUAD spheroid cells. P. CCK8. Q. Flow cytometry. The Right panel represents quantification of apoptosis cells. R. The protein levels in LUAD spheroid cells treated with autophagy activator Rapamycin and control. The Right panel represents quantification. S-T. The self-renewal capability of LUAD spheroid cells treated with Rapa and control. S. RT-qPCR. T. Single clone assay. The Right panel represents quantification of single clone assay. U-V. Drug resistance in LUAD spheroid cells treated with Rapa and control. U. CCK8. V. Flow cytometry. The Right panel represents quantification of apoptosis cells. *P < 0.05, **P < 0.01, ***P < 0.001
Fig. 3
Fig. 3
E2F1 is screened as a key regulator of stemness and autophagy in LUAD based on the “stemness score” model. (A) A flow chart indicating stemness genes screening. (B) Correlation heat map of enrichment scores of 11 gene sets in TCGA-LUAD samples. (C) Analyzing the reliability of stemness scores based on GEO database (GSE30654, GSE342000). (D) The stemness scores level in TCGA-LUAD dataset. E-F. The heat map (E) and pie map (F) demonstrate the value of stemness scores in evaluating LUAD-related clinical parameters. G-H. Comparison of stemness scores in different clinical parameter LUAD, Tumor staging (G), Tumor metastasis (H). I. The AUC of stemness score in TCGA-LUAD dataset. J. Kaplan-Meier estimates of the OS of patients with LUAD according to stemness score based on TCGA-LUAD dataset. K. Multivariate analysis of the correlation of stemness score with LUAD patients. L-M. The stemness-related (L) and autophagy-related (M) gene expression of stemness score high and low groups. N. Bar graph showing the enriched proportion of stemness-high peaks. O. Chart comparing the distribution of promoter area. P. Enrichment GO analysis showing the stemness function of peaks. Q. Enrichment KEGG analysis showing the potential function of peaks. R. GSEA assessment of stemness score high and low groups. S. Correlation of the expression of E2F family and stemness scores in LUAD. T. Correlation of the expression of E2F1 and stemness scores. U. Abundance of E2F1 mRNA expression of stemness score high and low groups. V. KEGG analysis of E2F1 high and low groups. W. GO enrichment analysis of E2F1 high and low groups. *P < 0.05, **P < 0.01, ***P < 0.001
Fig. 4
Fig. 4
E2F1 promotes self-renewal and drug resistance of lung cancer stem cells. (A) E2F1 expression in LUAD patient. B-D. E2F1 expression in LUAD parental and spheroid cells. (B) mRNA expression. C-D. Protein expression and quantification assay. E-F. The expression of E2F1 in sh-NC and sh-E2F1 of LUAD spheroid cells. E. RT-qPCR. F. Western blotting and quantification assay. G-I. The self-renewal capability of A549 spheroid sh-NC and sh-E2F1 cells. G. mRNA abundance of CSCs marker. H. Flow cytometry analysis of ALDH1A1 expression in LUAD parental and spheroid cells. The Right panel represents quantification of ALDH1A1 expression. I. Single clone assay and quantification assay. J-K. The drug resistance of A549 spheroid sh-NC and sh-E2F1 cells. J. CCK8. K. The cell apoptosis by flow cytometry analysis and quantification assay. L-N. Tumor formation in nude mice following injection of A549 spheroid cells sh-NC and sh-E2F1, respectively. L. The image of tumor. M. Tumor growth curves. N. Tumor weight. O-P. The expression of E2F1 in OE-Vector and OE-E2F1 of LUAD spheroid cells. O. RT-qPCR. P. Western blotting and quantification assay. Q-S. The self-renewal capability of A549 spheroid OE-Vector and OE-E2F1 cells. Q. mRNA expression of stemness genes. R. ALDH1A1 expression by flow cytometry and quantification assay. S. Single clone assay and quantification assay. T-U. The drug tolerance of A549 spheroid OE-Vector and OE-E2F1 cells. T. Flow cytometry analysis and quantification assay. U. CCK8. V-X. The gradient tumor formation assays in A549 spheroid OE-Vector and OE-E2F1 cells in BALB/c nude mice. V. Tumor volume. W. Tumor growth curve. X. Tumor weight. *P < 0.05, **P < 0.01, ***P < 0.001
Fig. 5
Fig. 5
E2F1 enhances autophagy to promote self-renewal and drug resistance of lung cancer stem cells. A-C. The autophagy flux and quantification assay of A549 spheroid sh-NC and sh-E2F1 cells. (A) Western blotting. (B) TEM analysis. (C) Autophagic flow by confocal microscope. (D) Expression of autophagy relative protein and quantification assay in A549 spheroid sh-NC and sh-E2F1 cells incubated with Rapa by western blotting. E-G. The self-renewal capability of A549 spheroid sh-E2F1 cells incubated with Rapa and control. (E) RT-qPCR. (F) Single clone assay and quantification assay. (G) Flow cytometry analysis and quantification assay. (H) The proliferation activities of A549 spheroid sh-E2F1 cells by pre-incubated with Rapa and control, and treated with cisplatin. I-J. The autophagy flux and quantification assay of A549 spheroid OE-Vector and OE-E2F1 cells. (I) Western blotting. (J) TEM analysis. K. The autophagy protein expression and quantification assay of A549 spheroid OE-E2F1 + si-NC and OE-E2F1 + si-Beclin1 cells. L-M. The self-renewal ability of A549 spheroid OE-E2F1 + si-NC and OE-E2F1 + si-Beclin1 cells. L. RT-qPCR. M. Single clone assay and quantification assay. N-O. The drug tolerance of A549 spheroid OE-E2F1 + si-NC and OE-E2F1 + si-Beclin1 cells. N. CCK8. O. Flow cytometry assay and quantification assay. P-R. Subcutaneous tumors were harvested after LUAD spheroid OE-E2F1 + si-NC and OE-E2F1 + si-Beclin1 cells in BALB/c nude mice. P. Tumor volume. Q. Tumor growth curve. R. Tumor weight
Fig. 6
Fig. 6
ALDH1A1 as stemness marker enhances self-renewal and drug resistance of lung cancer stem cells. (A) ALDH1A1 mRNA expression of stemness score high and low groups. (B) Correlation of ALDH1A21 expression and stemness in LUAD. (C) Kaplan-Meier estimates of the OS of patients with LUAD according to ALDH1A1 levels. (D) Immunohistochemical staining of ALDH1A1 in LUAD and its adjacent tissues, scale bar = 60 μm (upper panels), scale bar = 30 μm (lower panels). E-F. ALDH1A1 expression in LUAD spheroid OE-Vector and OE-ALDH1A1 cells. (E) mRNA expression. (F) Western blotting and quantification assay. G-H. The self-renewal activity of A549 spheroid OE-Vector and OE-ALDH1A1 cells. (G) CSCs markers by RT-qPCR. (H) Spheroid formation by single clone assay and quantification assay. I-J. The drug resistance of A549 spheroid OE-Vector and OE-ALDH1A1 cells. (I) The proliferation activity. (J) Flow cytometry assay and quantification assay. K. The autophagy relative protein expression and quantification assay of A549 spheroid si-Beclin1 + OE-Vector and si-Beclin1 + OE-ALDH1A1 cells. L-M. The self-renewal capability of A549 spheroid si-Beclin1 + OE-Vector and si-Beclin1 + OE-ALDH1A1 cells. L. RT-qPCR. M. Single clone assay and quantification assay. N-O. The therapy tolerance of A549 spheroid si-Beclin1 + OE-Vector and si-Beclin1 + OE-ALDH1A1 cells. N. CCK8 assay. O. Cell apoptosis by flow cytometry and quantification assay
Fig. 7
Fig. 7
E2F1-autophagy-ALDH1A1 axis promotes self-renewal and drug resistance of lung cancer stem cells in a p53-dependent manner. A-B. P53 expression in LUAD parental and spheroid cells. (A) mRNA abundance. (B) Protein expression and quantification assay. (C) P53 mRNA expression in A549 spheroid sh-NC/sh-E2F1 and OE-Vector/OE-E2F1 cells. (D) P53 protein expression in A549 spheroid sh-NC/sh-E2F1 and OE-Vector/OE-E2F1 cells and quantification assay. (E) P53 mRNA expression in A549 spheroid/H1299 spheroid OE-Vector and OE-P53 cells. (F) Autophagy relative protein expression and quantification assay in LUAD spheroid OE-Vector and OE-p53 cells. (G) Stemness associated genes expression in A549 spheroid OE-Vector and OE-p53 cells. (H) Autophagy relative protein expression and quantification assay in A549 spheroid cells incubated with proteasome inhibitor Bortezomib. (I) Protein abundance and quantification assay of autophagy in A549 spheroid cells incubated with Bortezomib and Rapa. J-K. ALDH1A1 expression in A549 spheroid cells treated with Bortezomib and Rapa. (J) RT-qPCR. K. Western blotting and quantification assay. L-M. The self-renewal capability of A549 spheroid cells treated with Bortezomib and Rapa. L. mRNA abundance of stemness genes. M. Single clone assay and quantification assay. N. Cell viability of A549 spheroid cells treated with Bortezomib and Rapa by CCK8. O. Immunohistochemical staining of E2F1 in LUAD and its adjacent tissues, scale bar = 60 μm (upper panels), scale bar = 30 μm (lower panels). P-Q. The diagnostic assessment of E2F1 expression in LUAD patients and healthy groups. P. The protein abundance in serum. Q. ROC curve. R. The chart summary of “E2F1-autophagy-ALDH1A1” axis enhances self-renewal and drug resistance of lung CSCs in a p53 dependent manner

Similar articles

References

    1. Lin JJ, Cardarella S, Lydon CA, Dahlberg SE, Jackman DM, Jänne PA, et al. Five-Year survival in EGFR-Mutant metastatic lung adenocarcinoma treated with EGFR-TKIs. J Thorac Oncol. 2016;11(4):556–65. - PMC - PubMed
    1. Sung H, Ferlay J, Siegel RL, Laversanne M, Soerjomataram I, Jemal A, et al. Global cancer statistics 2020: GLOBOCAN estimates of incidence and mortality worldwide for 36 cancers in 185 countries. CA Cancer J Clin. 2021;71(3):209–49. - PubMed
    1. Batlle E, Clevers H. Cancer stem cells revisited. Nat Med. 2017;23(10):1124–34. - PubMed
    1. Huang T, Song X, Xu D, Tiek D, Goenka A, Wu B, et al. Stem cell programs in cancer initiation, progression, and therapy resistance. Theranostics. 2020;10(19):8721–43. - PMC - PubMed
    1. Yeung TM, Gandhi SC, Wilding JL, Muschel R, Bodmer WF. Cancer stem cells from colorectal cancer-derived cell lines. Proc Natl Acad Sci U S A. 2010;107(8):3722–7. - PMC - PubMed

MeSH terms