. 2025 Aug 30;17(1):146.
doi: 10.1186/s13148-025-01943-8.

Selective disruption of DNMT1/ELK1 interactions induces DGKI re-expression and promotes temozolomide sensitivity of MGMTmethylated/DGKImethylated glioblastoma

Affiliations

Selective disruption of DNMT1/ELK1 interactions induces DGKI re-expression and promotes temozolomide sensitivity of MGMTmethylated/DGKImethylated glioblastoma

Jean-Maxime Besson et al. Clin Epigenetics. .

Abstract

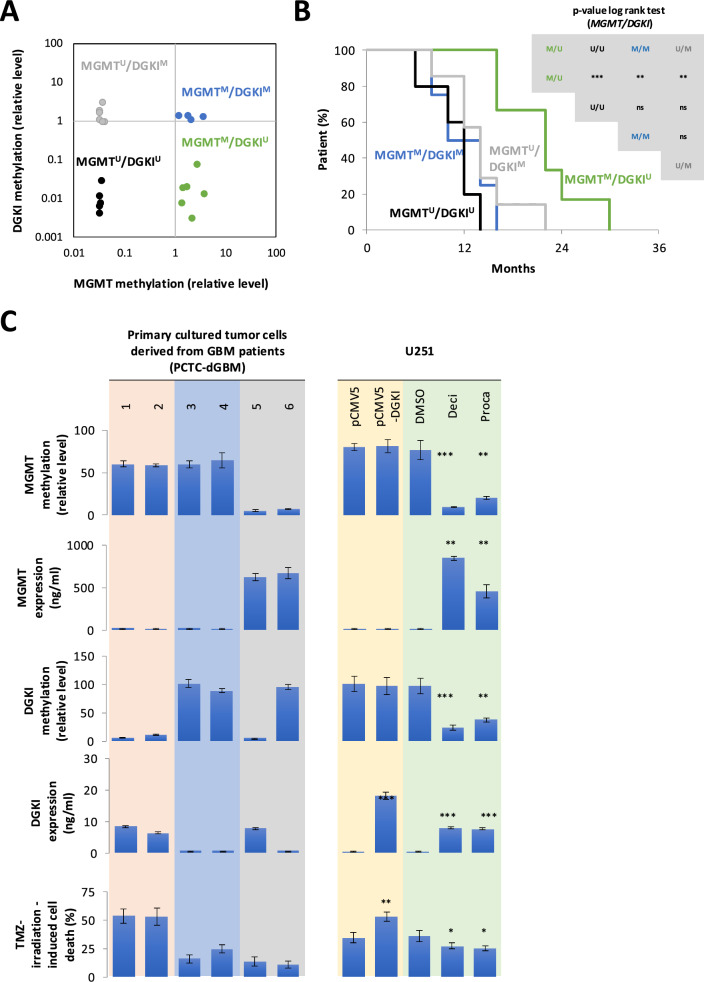
Background: DNA methyltransferase (DNMT) inhibitors are emerging as a promising class of agents for personalized and targeted cancer therapy, particularly in malignancies with limited therapeutic options such as glioblastoma (GB). In GB, the MGMT/DGKI methylation profile serves as a biomarker for stratifying patients by treatment response. Specifically, the MGMTmethylated/DGKIunmethylated profile is associated with favorable outcomes, whereas the MGMTmethylated/DGKImethylated profile correlates with poor outcome. These findings suggest that selective demethylation of DGKI without altering MGMT or inducing widespread genomic hypomethylation, which may promote tumorigenesis, could represent a novel and more effective therapeutic strategy.

Results: Current DNMT inhibitors lack specificity for glioblastoma relevant methylation profiles, thereby limiting their therapeutic efficacy. To address this challenge, AlphaFold-based protein-protein interaction predictions were integrated with sequential chromatin immunoprecipitation assays and established DNMT1 interactome data. This integrative approach led to the identification of a DNMT1/ELK1 complex as a critical regulator of DGKI methylation. A peptide mimicking the DNMT1/ELK1 interface, designated EXDDNMT1/ELK1, was designed and shown to induce selective DGKI demethylation without altering MGMT or inducing global DNA hypomethylation. Notably, EXDDNMT1/ELK1 did note promote cellular proliferation or invasion, and successfully restored sensitivity to standard glioblastoma therapy in both cellular and in vivo models. These findings also support the use of MGMT and DGKI methylation levels in cell-free DNA as potential biomarkers to identify patients likely to benefit from EXDDNMT1/ELK1 treatment.

Conclusion: This study identifies a clinically actionable biomarker (MGMTMethylated/DGKIMethylated), detectable in both solid and liquid biopsies, enabling patient stratification. Furthermore, it establishes EXDDNMT1/ELK1 as a highly selective epigenetic therapeutic agent to treat GB patients.

Keywords: DNMT1; ELK1; Epidrug; Peptide; Protein–protein interaction.


Conflict of interest statement

Declarations. Ethics approval and consent to participate: Tumors were collected from the “French Glioblastoma Biobank FGB” [8]. The FGB network was declared to the French Ministry of Health and Research (declaration number: DC-2011-1467, cession authorization number: AC-2017-2993). The protocols and regulations of the FGB network were approved by the CPP OUEST II ethics committee (CB 2012/02, date of approval: 20 December 2011) and the CNIL (no. 1476342, date of approval: 10 October 2011). Plasma was collected from patients treated at the “Institut de Cancérologie de l’Ouest” (ICO, http://www.ico-cancer.fr ). All patients recruited gave signed and informed consent. All the samples collected and the associated clinical information were registered in the database (N° DC-2018-3321) validated by the French research ministry. Biological resources were stored at the “Centre de Ressources Biologiques-Tumorothèque (CRB)” (Institut de Cancérologie de l’Ouest, Saint-Herblain, F44800, France) [9]. Consent for publication: All authors have given consent for publication. Competing interests: The authors declare no competing interests.

Figures

Fig. 1
Fig. 1
DGKI expression and methylation status are implicated in the response to standard glioblastoma therapy. A Twenty-two glioblastoma patients were stratified into four subgroups based on relative MGMT and DGKI methylation levels, as determined by the qMSRE assay. Each circle on the graph represents an individual patient. B Kaplan–Meier curves representing the overall survival of the four subgroups of GB patients obtained by considering the MGMT and DGKI methylation levels. C Graphs show the relationships between MGMT and DGKI methylation, their corresponding expression levels, and the percentage of cell death induced by TMZ and irradiation. Left panels correspond to six patient-derived glioblastoma primary cultures. Right panels correspond to U251 glioblastoma cells transfected with a DGKI-expressing plasmid (pCMV5-DGKI, Addgene, France), control plasmid (pCMV5) and treated (72 h) with two DNMT inhibitors: Decitabine (Deci, 1 M) and Procainamide (Proca, 0.5 M). T test was performed to estimate the significant difference between control and indicated conditions (p < 0.05*, p < 0.01** and p < 0.001***)
Fig. 2
Fig. 2
Design of a DNMT1/ELK1 interaction inhibitor to demethylate DGKI without demethylating MGMT. A Identification of DNMT1/ELK1 as key regulators of DGKI methylation. The schematic “metro map” illustrates the stepwise strategy used to predict candidate regulators of DGKI methylation. The graph shows the effect of siRNA-mediated knockdown of selected factors on DGKI methylation levels. T test was performed to estimate the significant difference between control and indicated conditions (p < 0.05*, p < 0.01** and p < 0.001***). B The computational model depicts the interactions between a selected region of DNMT1 (349–500) shown in blue and in green, and the structured region 1–95 of ELK1 displayed in orange. The green region represents the 461–471 amino acids regions of DNMT1 interacting with ELK1. The model confidence was calculated using a combination of pTM and ipTM score, as reported in Materials and Methods. C The ChIP and ReChIP experiments were performed 24 h after the cells were treated with 0.5 µM of each indicated peptide. Graph illustrates the impact of EXDDNMT/ELK1 and EXDDUP on DNMT1 and ELK1 enrichment on DGKI promoter. IgG was used as negative control on ChIP and reChIP experiments. T test was performed to estimate the significant difference between control and indicated conditions (p < 0.05*, p < 0.01** and p < 0.001***). D qMSRE were performed 24 h after the cells were treated with 0.5 µM of each indicated peptide. Graph illustrates the impact of EXDDNMT/ELK1 and EXDDUP on the DGKI and MGMT methylation levels. T test was performed to estimate the significant difference between control and indicated conditions (p < 0.05*, p < 0.01** and p < 0.001***). E ELISA was performed 24 h after the cells were treated with 0.5 µM of each indicated peptide. Graph illustrates the impact of EXDDNMT/ELK1 and EXDDUP on DGKI expression T test was performed to estimate the significant difference between control and indicated conditions (p < 0.05*, p < 0.01** and p < 0.001***)
Fig. 3
Fig. 3
EXDDNMT1/ELK1 increases the TMZ/IR-induced cell death and unchanged the cellular proliferation, invasion and migration. A Graphs show the effects of various DNA hypomethylating agents on TMZ/irradiation-induced cell death, cell doubling time, migration index, global DNA methylation levels, and the modulation score of cancer hallmarks. (SMoCH) (− 1 when the peptide/treatment enhanced a cancer hallmark, 0 when peptide/treatment did not modify a cancer hallmark and + 1 when the peptide/treatment inhibited a cancer hallmark). Experiments were performed 72 h after the cells were treated with 1 µM of Decitabine (Deci), 0.5 µM of Procainamide (proca) of 0.5 µM of each indicated peptide. T test was performed to estimate the significant difference between control and indicated conditions (p < 0.05*, p < 0.01** and p < 0.001***). B Schematic overview of the treatment protocol in mice. Upon reaching a tumor volume of ~ 100 mm3, mice were randomly assigned to the indicated treatment groups. TMZ (25 mg/kg) was administered intraperitoneally (i.p.), and EXDDNMT1/ELK1 was delivered intratumorally (i.t.). The photograph shows resected tumors after 3 weeks of treatment. The graph depicts tumor volume responses across three distinct patient-derived xenograft (PDX) models. T test was performed to estimate the significant difference between control and indicated conditions (p < 0.05*, p < 0.01** and p < 0.001***). C Graph shows changes in MGMT and DGKI methylation levels following treatment. T test was performed to estimate the significant difference between control and indicated conditions (p < 0.05*, p < 0.01** and p < 0.001***)
Fig. 4
Fig. 4
EXDDNMT1/ELK1 limits the TMZ resistance acquisition. A Graphs depict MGMT (blue) and DGKI (orange) methylation levels in glioblastoma cell lines (U373, U87, and A172) before and after 8 weeks of temozolomide treatment. Sensitivity and resistance was defined based on TMZ IC₅₀ values (gray). T test was performed to estimate the significant difference between control and indicated conditions (p < 0.05*, p < 0.01 ** and p < 0.001***). B Graphs illustrate the MGMT (blue) and DGKI (orange) relative methylation levels in tumor reSect. "Introduction" (R1) and 2 (R2) derived from 15 GB patients. C Evolution of DGKI and MGMT methylation levels between the first (R1) and second (R2) tumor resections in the 15 glioblastoma patients included in the study. Black circle represents a methylated gene and open circle represents an unmethylated gene. Green panels underline the presence of the MGMTmethyalted/DGKIunmethyalted favorable signature. D Graphs illustrate the evolution of the MGMT and DGKI methylation levels in cfcDNA of five GB patients. E IC50 curves of temozolomide for A172 cells (black line), A172 cells treated during 8 weeks with TMZ (A172-8w, gray line) and A172 cells treated during 8 weeks with TMZ and EXDDNMT1/ELK1 (A172-8w + EXDDNMT1/ELK1, dark red line)

Similar articles

References

    1. Hanif F, Muzaffar K, Perveen K, Malhi SM, Simjee SU. Glioblastoma multiforme: a review of its epidemiology and pathogenesis through clinical presentation and treatment. Asian Pac J Cancer Prev APJCP. 2017;18:3–9. - PMC - PubMed
    1. Tamimi AF, Juweid M. Epidemiology and Outcome of Glioblastoma. In: De Vleeschouwer S, editor. Glioblastoma [Internet]. Brisbane (AU): Codon Publications. 2017. Available from: http://www.ncbi.nlm.nih.gov/books/NBK470003/. - PubMed
    1. Batash R, Asna N, Schaffer P, Francis N, Schaffer M. Glioblastoma multiforme, diagnosis and treatment; recent literature review. Curr Med Chem. 2017;24:3002–9. - PubMed
    1. Sasmita AO, Wong YP, Ling APK. Biomarkers and therapeutic advances in glioblastoma multiforme. Asia Pac J Clin Oncol. 2018;14:40–51. - PubMed
    1. Mensali N, Inderberg EM. Emerging biomarkers for immunotherapy in glioblastoma. Cancers. 2022;14:1940. - PMC - PubMed

MeSH terms