. 2025 Nov:101:102241.
doi: 10.1016/j.molmet.2025.102241. Epub 2025 Aug 29.

Suppression of adipocyte ABHD6 favors anti-inflammatory and adipogenic programs to preserve adipose tissue fitness in obesity

Affiliations

Suppression of adipocyte ABHD6 favors anti-inflammatory and adipogenic programs to preserve adipose tissue fitness in obesity

Pegah Poursharifi et al. Mol Metab. 2025 Nov.

Abstract

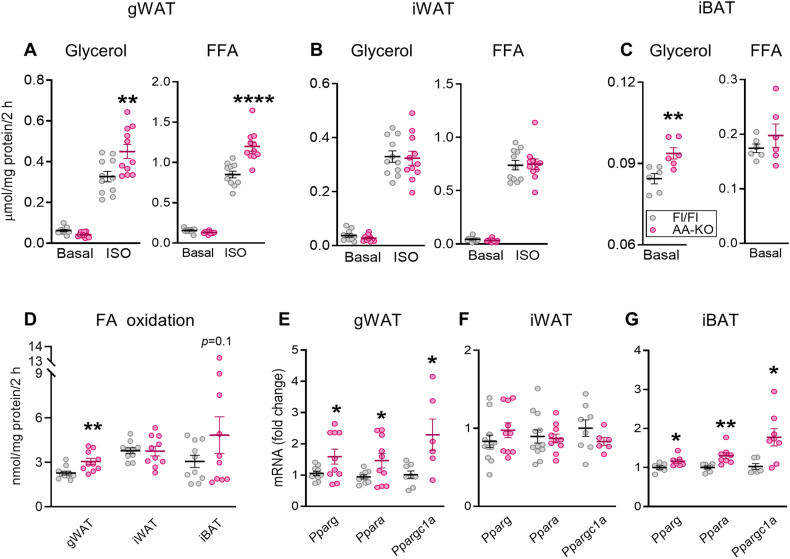
Some individuals exhibit metabolically healthy obesity, characterized by the expansion of white adipose tissue (WAT) without associated complications. The monoacylglycerol (MAG) hydrolase α/β-hydrolase domain-containing 6 (ABHD6) has been implicated in energy metabolism, with its global deletion conferring protection against obesity. However, the immunometabolic roles of adipocyte ABHD6 in WAT remodeling in response to nutri-stress and obesity are not known. Here, we demonstrate that in insulin resistant women, ABHD6 mRNA expression is elevated in visceral fat and positively correlates with obesity and metabolic dysregulation. ABHD6 expression is also elevated in the WATs of diet-induced obese and db/db mice. Although adipocyte-specific ABHD6 knockout (AA-KO) mice become obese under high-fat diet, they show higher plasma adiponectin, reduced circulating insulin and inflammatory markers, improved insulin sensitivity, and lower plasma and liver triglycerides. They also show enhanced insulin action in various tissues, but normal glucose tolerance. In addition, AA-KO mice display healthier and less inflamed expansion of visceral fat, with smaller adipocytes and higher stimulated lipolysis and fatty acid oxidation levels. Similar but less prominent phenotype was found in the subcutaneous and brown fat depots. Thus, adipocyte ABHD6 suppression prevents most of the metabolic and inflammatory complications of obesity, but not obesity per se. Mechanistically, this beneficial process involves a rise in MAG levels in mature adipocytes, and their secretion, resulting in a crosstalk among adipocytes, preadipocytes and macrophages in the adipose microenvironment. Elevated intracellular MAG causes PPARs activation in adipocytes, and MAG secreted from adipocytes curtails the inflammatory polarization of macrophages and promotes preadipocyte differentiation. Hence, adipocyte ABHD6 and MAG hydrolysis contribute to unhealthy WAT remodeling and expansion in obesity, and its suppression represents a candidate strategy to uncouple obesity from many of its immunometabolic complications.

Keywords: Adipose tissue; Inflammation; Insulin signaling; Macrophages; Monoacylglycerol; Obesity; PPARs; α/β-hydrolase domain-containing 6.


Conflict of interest statement

Declaration of competing interest The authors declare the following financial interests/personal relationships which may be considered as potential competing interests: Marc Prentki reports financial support was provided by Canadian Institutes of Health Research. If there are other authors, they declare that they have no known competing financial interests or personal relationships that could have appeared to influence the work reported in this paper.

Figures

Image 1
Graphical abstract
Figure 1
Figure 1
ABHD6 expression in the visceral fat depots is positively correlated with the extent of obesity/insulin resistance/dyslipidemia in humans and in the db/db mice.A- D) ABHD6 mRNA and protein expression in WAT from db/+ control (glycemia prior to sacrifice: 6.9 ± 0.3 mM) and db/db mice (diabetic; glycemia prior to sacrifice: 31.3 ± 1.8 mM) (5 mice/group). Student's t test; ∗p < 0.05. E-L, O and P) Linear regression analysis (r2 and p values by Pearson correlation) of ABHD6 expression in the omental fat in female subjects vs. BMI (kg/m2), L2L3 area (cm2), sagittal abdominal diameter (cm), homeostatic model assessment for insulin resistance (HOMA-IR), VLDL-cholesterol (chol) (mmol/L), triglyceride (TG) (mmol/L), VLDL-TG (mmol/L) and insulin (pmol/L). M and N)ABHD6 mRNA levels.
Figure 2
Figure 2
High fat diet-fed adipocyte-specific ABHD6-KO mice display improved metabolic phenotype despite becoming obese. Adipose tissue-specific ABHD6 KO (AA-KO) mice were generated as detailed in the Methods. After tamoxifen treatments, mice were fed a 60% a high fat diet (HFD) for 12 weeks (7–12 mice/group). A-E and K-Q male and F-J female mice. A) Body weight. B) Body composition by EcoMRI. C) Adipose tissues weight. D) Oral glucose tolerance test (OGTT); area under the curve (AUC). E) Insulin tolerance test (ITT); area above the curve (AAC). F) Body weight. G) Body composition by EcoMRI. H) Adipose tissues weight. I) OGTT. J) ITT. K) Fed insulin levels. L) Liver triglyceride (TG) content. M) Plasma TG. N) Plasma adiponectin. O) Plasma cytokines/chemokines. P, Q)In vivo insulin signaling analysis. Student's t test (A, D, E, F-J); One-way ANOVA (B, C, K, L); Two-way ANOVA (D, E, I, J); ∗p < 0.05, ∗∗∗p < 0.001, ∗∗∗∗p < 0.0001.
Figure 3
Figure 3
Adipocytes/lipid droplets are smaller in all fat depots from HFD-fed AA-KO mice. Adipose tissues were harvested from HFD-fed mice.A) Representative images from hematoxylin and eosin (H&E) stained sections of adipose depots (5 mice/group). Scale bar = 300 μm. B) Average adipocyte and lipid droplet (LD) area and number. C) The frequency distribution of adipocyte cell/LD size, expressed as percentage. Student's t test (B); ∗p < 0.05, ∗∗p < 0.01, ∗∗∗∗p < 0.0001.
Figure 4
Figure 4
Visceral fat from HFD-fed AA-KO mice exhibits enhanced stimulated-lipolysis and fat oxidation. Adipose tissues were harvested from HFD-fed mice (n = 6–10 mice/group). A-C) Glycerol release from isolated mature white adipocytes and iBAT explants. D-F) Free fatty acid (FFA) release from isolated mature white adipocytes and iBAT explants. G) FA/palmitate oxidation. H-J)Pparg, Ppara and Ppargc1a mRNA expression. Student's t test (C, F, G-J); One-way ANOVA (A, B, D, E); ∗p < 0.05, ∗∗p < 0.01, ∗∗∗∗p < 0.0001.
Figure 5
Figure 5
Adipocyte-specific ABHD6 deletion promotes anti-inflammatory profile of fat depots in obese mice. Adipose tissues were harvested from HFD-fed mice.A, D, F) Representative images from crown-like structures (CLS) stained sections of adipose depots. Quantification was performed as the average of 5 fields per depot per mouse, with data representing 5 mice per group. Scale bar = 200 μm. B, C, E, G) mRNA levels of the adipokines, cytokines, and pro/anti-inflammatory and macrophage markers (6–14 mice/group). Student's t test; ∗p < 0.05, ∗∗p < 0.01, ∗∗∗p < 0.001.
Figure 6
Figure 6
Conditioned-medium from ABHD6-deficient adipocytes promotes anti-inflammatory polarization of macrophages and preadipocyte differentiation. Conditioned-media (CM) were collected from gWAT mature adipocytes of HFD-fed AA-KO and Fl/Fl mice (A) and its inflammatory and pro-adipogenic effects were assessed in RAW 264.7 macrophages and 3T3-L1 cells, respectively (6 wells/condition). B) Representative images showing oil red O staining of RAW 264.7 macrophages before and after treatment with the CM. Scale bar = 100 μm. C) Oil red O quantification. D-G)Tnfa, Cd11c, Glut1 and Arg1 mRNA levels in RAW 264.7 macrophages. H)Pref1, Pparg, Cebpa and Cebpb mRNA levels in 3T3-L1 preadipocytes treated with CM for 48 h. I) Representative images showing oil red O staining of 3T3-L1 cells after 10 days of treatment with the CM. Scale bar = 100 μm. J) Oil red O quantification. K) Representative images showing oil red O staining of insulin-induced differentiated 3T3-L1 cells after 10 days of treatment with the CM. Scale bar = 100 μm. L) Oil red O quantification. One-way ANOVA (C–G); Student's t test (H, J, L); ∗p < 0.05, ∗∗p < 0.01, ∗∗∗p < 0.001.
Figure 7
Figure 7
Monoacylglycerol and adiponectin are increased in conditioned-medium of ABHD6-KO adipocytes and MAGs exert PPAR agonist like effects on the proliferation and differentiation of 3T3-L1 cells.A-C) Analysis of 1/2-MAG (total MAG), 1-MAG, and 2-MAG species in the CM (6 mice/group). Depicted are analyte peak areas, normalized to respective internal standard (ISTD) peak areas, of representative lipids for each analyzed lipid class. D) Growth curve representing the number of 3T3-L1 preadipocytes of the indicated conditions at different time points (days 0, 1, 2, 3, and 4). Data points are the mean values of three independent experiments. E)Pref1 mRNA levels in 3T3-L1 preadipocytes. F–H) Pparg, and Fabp4 mRNA levels and oil red O quantification in insulin-differentiated 3T3-L1 cells, following incubations with MAGs and PPAR agonists, as indicated. I and J)Ppara and AdipoR2 mRNA levels in 3T3-L1 preadipocytes following incubations with MAGs and PPAR agonists, as indicated. K and L) Adiponectin and IL-6 levels in the CM (6 mice/group). Total of 4–8 wells/condition for all the in vitro assays. Two-way ANOVA (A–D); One-way ANOVA (E–J); Student's t test (K, L); ∗p < 0.05, ∗∗p < 0.01, ∗∗∗∗p < 0.0001.
figs1
figs1
figs2
figs2
figs3
figs3

References

    1. Sakers A., De Siqueira M.K., Seale P., Villanueva C.J. Adipose-tissue plasticity in health and disease. Cell. 2022;185(3):419–446. - PMC - PubMed
    1. Vishvanath L., Gupta R.K. Contribution of adipogenesis to healthy adipose tissue expansion in obesity. J Clin Investig. 2019;129(10):4022–4031. - PMC - PubMed
    1. Ghaben A.L., Scherer P.E. Adipogenesis and metabolic health. Nat Rev Mol Cell Biol. 2019;20(4):242–258. - PubMed
    1. Petersen M.C., Shulman G.I. Mechanisms of insulin action and insulin resistance. Physiol Rev. 2018;98(4):2133–2223. - PMC - PubMed
    1. Strissel K.J., Stancheva Z., Miyoshi H., Perfield J.W., 2nd, DeFuria J., Jick Z., et al. Adipocyte death, adipose tissue remodeling, and obesity complications. Diabetes. 2007;56(12):2910–2918. - PubMed

Substances