. 2025 Aug 31;15(1):32030.
doi: 10.1038/s41598-025-17477-1.

Protocol optimization improves the performance of multiplexed RNA imaging

Affiliations

Protocol optimization improves the performance of multiplexed RNA imaging

Josh J Luce et al. Sci Rep. .

Abstract

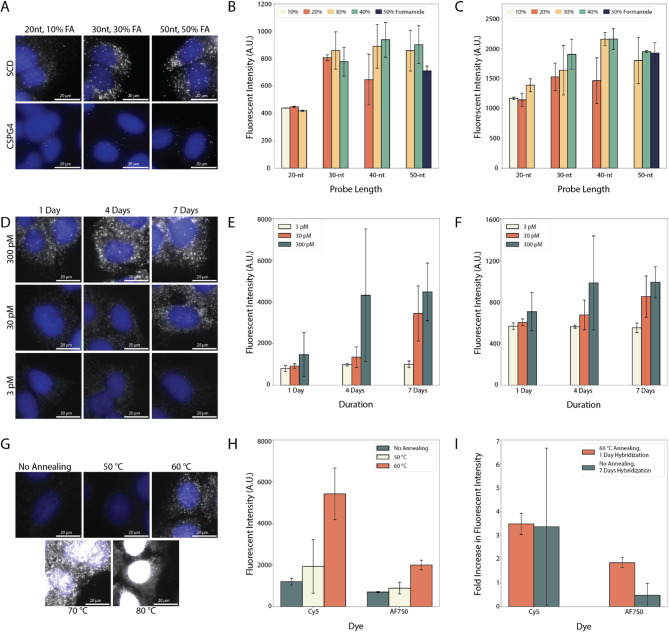
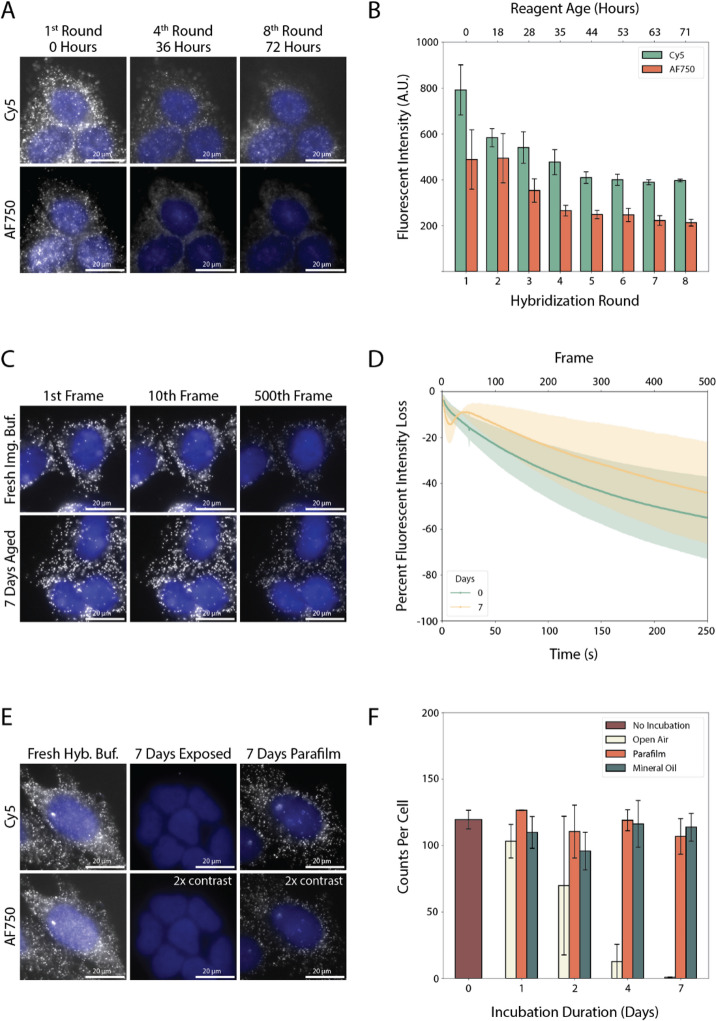
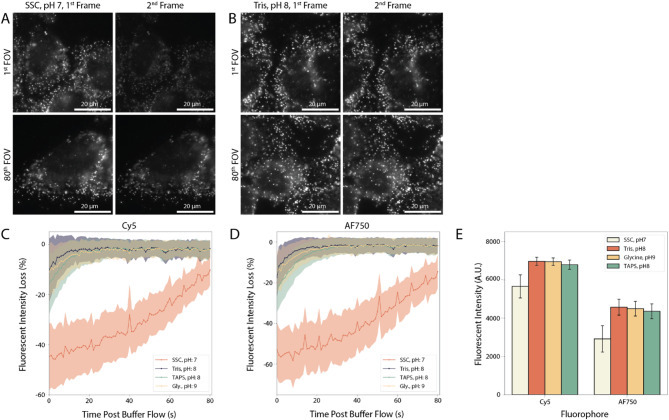
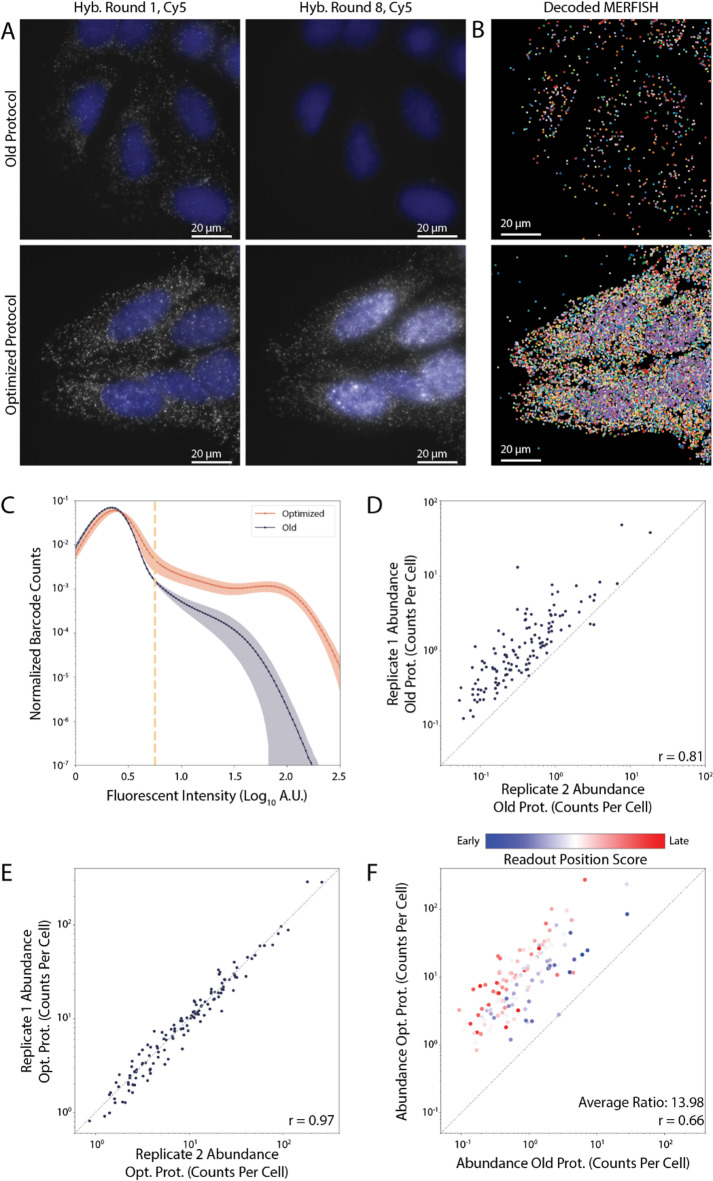
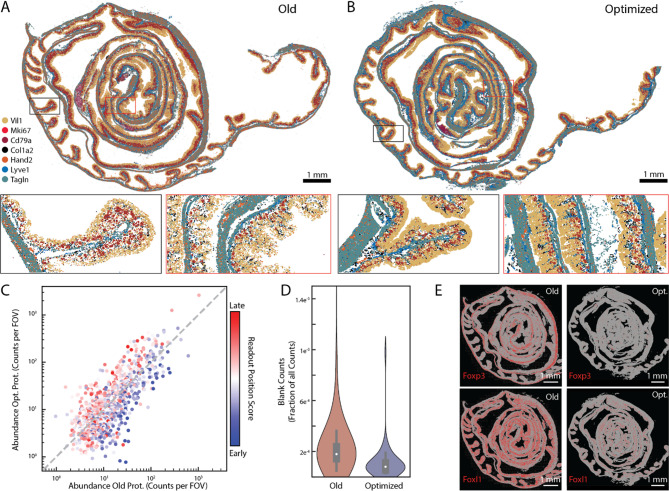
Spatial transcriptomics has emerged as a powerful tool to define the cellular structure of diverse tissues. One such method is multiplexed error robust fluorescence in situ hybridization (MERFISH). MERFISH identifies RNAs with error tolerant optical barcodes generated through sequential rounds of single-molecule fluorescence in situ hybridization (smFISH). MERFISH performance depends on a variety of protocol choices, yet their effect on performance has yet to be systematically examined. Here we explore a variety of properties to identify optimal choices for probe design, hybridization, buffer storage, and buffer composition. In each case, we introduce protocol modifications that can improve performance, and we show that, collectively, these modified protocols can improve MERFISH quality in both cell culture and tissue samples. As RNA FISH-based methods are used in many different contexts, we anticipate that the optimization experiments we present here may provide empirical design guidance for a broad range of methods.

Keywords: Fluorescence in situ hybridization; Multiplexed error robust in situ hybridization (MERFISH); RNA; Spatial transcriptomics.


Conflict of interest statement

Declarations. Competing interests: JRM is a co-founder of, stakeholder in, and advisor for Vizgen, Inc. JRM is an inventor on patents associated with MERFISH applied for on his behalf by Harvard University and Boston Children’s Hospital. JRM’s interests were reviewed and are managed by Boston Children’s Hospital in accordance with their conflict-of-interest policies. CAR-L and PC are inventors on patents associated with aspects of MERFISH not included in this work applied for on their behalf by Boston Children’s Hospital. The other authors have no competing interests.

Figures

Fig. 1
Fig. 1
The Role of Encoding Probe Design and Hybridization on Single-Molecule Signal Brightness. (A) Images of U-2 OS cells stained with encoding probes that contain 20-nt (left), 30-nt (middle), or 50-nt (right) target regions and which were stained with optimal formamide (FA) concentrations for those lengths (10%, 30%, and 50%, respectively). Two different mRNAs were targeted: SCD (top) or CSPG4 (bottom). (B, C) Single-molecule signal brightness for encoding probes with different target region lengths and stained with different formamide concentrations (bar colors) for probes targeting SCD (B) or CSPG4 (C). (D) Images of U-2 OS cells stained with encoding probes targeting 130 RNAs and the first Cy5-labeled readout sequence. Encoding probes were stained at different per-probe concentrations (rows) and for different durations (columns). (E, F) Single-molecule signal brightness for the first Cy5-labeled readout probe (E) and the first AF750-labeled readout probe (F) for samples prepared as in (D) for the listed per-probe concentrations and hybridization durations. (G) Images of U-2 OS cells stained for encoding probes targeting 130 RNAs and the first Cy5-labeled readout sequence when annealed at 50, 60, 70, or 80 °C. A control without this melting and annealing protocol (No Annealing) is also shown. (H) Single-molecule signal brightness for the first Cy5-labeled readout probe (left) or the first AF750-labeled readout probe (right) for samples prepared as in (G) for the listed melting temperature. (I) The fold increase in the average molecular brightness for samples with a 60 °C melting and annealing step and 1 day of hybridization or for samples without a melting and annealing step and 7 days of hybridization as compared to a sample without melting and annealing and 1 day of hybridization. Samples were stained with an encoding probe library targeting 130 RNAs and the first readout probes conjugated to Cy5 or AF750. For A, D, and G: Gray: mRNA signal. Blue: DAPI. Scale bars: 20 μm. For B, C, E, F, H, I: Bars and error bars represent the average or standard deviation across at least two replicates of the average plotted quantities seen within each replicate.
Fig. 2
Fig. 2
Long-Term Stability of MERFISH Readout Reagents. (A) Images of U-2 OS cells stained with encoding probes that target 130 RNAs and the first Cy5- or AF750-labeled readouts in the first imaging round (left), the fourth Cy5- or AF750-labeled readouts in the fourth imaging round (middle), or the eighth Cy5- or AF750-labeled readout probes in the eighth imaging round (right). The titles list the approximate time since the readout reagents were made. (B) Single-molecule signal brightness for the Cy5 or AF750 channels in each of the hybridization and imaging rounds with the approximate age of the readout reagents. (C) Images of U-2 OS cells stained with encoding probes that target FLNA and with a Cy5-labeled readout probe after 1, 10, or 500 image exposures with an imaging buffer prepared freshly (top row) or prepared and aged for 7 days at room temperature protected from oxygen (bottom). (D) Single-molecule signal brightness measured for the Cy5 channel versus the total exposure time for samples as in (C). Intensity is measured in precent brightness decrease relative to that observed in the first image. (E) Images of U-2 OS cells stained with encoding probes that target 130 RNAs and with Cy5-labeled (top) or AF750-labeled (bottom) readout probes in hybridization reagents that were prepared freshly (left) or prepared and aged in the dark but exposed to the room environment for 7 days covered (right) or uncovered (middle). Where denoted the contrast has been increased by 2-fold. (F) RNA copy number per cell for samples prepared as in (E). ‘No incubation’ indicates reagents prepared freshly, ‘Open Air’ indicates reagents aged in the dark but exposed to the room environment, ‘Parafilm’ and ‘Mineral Oil’ indicate reagents aged in the dark but protected from the room environment with parafilm or a layer of mineral oil, respectively. For A, C, E: Gray: mRNA signal. Blue: DAPI. Scale bars: 20 μm. For B, D, F: Bars and error bars or shaded regions represent the average and standard deviation derived from the plotted quantity from each of at least two replicates.
Fig. 3
Fig. 3
Improved Dye Brightness and Stability with Revised Readout Reagent Buffers. (A, B) Images of U-2 OS cells stained with encoding probes that target 130 RNAs and with the first Cy5-labeled readout probe after the first (left) or second (right) exposure of the same sample region in an imaging buffer with a base of saline sodium citrate (SSC) pH 7 (A) or a Tris-HCl pH 8 (B). The top and bottom rows represent images from the first (top) or 80th (bottom) field of view (FOV) imaged immediately after imaging buffer was flown into the sample. (C, D) Precent loss in single-molecule brightness in the second imaged frame relative to that of the first imaged frame for Cy5 (C) or AF750 (D) imaged in imaging buffers with bases of SSC pH 7, Tris pH 8, TAPS pH 8, or Glycine (Gly.) pH 9 (Methods). (E) Average first-frame single-molecule signal brightness measured for the Cy5 and AF750 channels across all FOVs of the measurements in (A) and (B). For A and B: Gray: mRNA signal. Scale bars: 20 μm. For C, D, and E: Bars or solid lines represent averages and shaded areas or error bars represent standard deviation across the average of plotted quantities seen between two replicates.
Fig. 4
Fig. 4
Non-Specific Readout Probe Binding Influences False Positive Rates. (A) mRNA abundance determined via MERFISH versus bulk RNA sequencing for measurements of the colon. The distribution for the blank barcodes is included (left). (B) mRNA abundance determined via MERFISH from two replicates of the mouse colon. mRNAs: blue. Blank barcodes: red. (C) Readout usage score (Methods) for all blank barcodes measured in a mouse colon dataset. Red marks visible outliers. (D-G) Images of mouse colon (D), ileum (E), U-2 OS cells (F), and HEK293 cells (G) stained for DAPI and with the listed readout probes (Table S2). These samples were not stained with encoding probes (Methods). (H) Background binding score for readouts in different tissues. Red: High background. Green: minimal or no detected background. Gray: Not measured. M: mouse. H: human. TG: trigeminal ganglia. For A and B: r represents the Pearson correlation coefficient between the logarithmic expression values. FPKM: Fragments per kilobase per million reads.
Fig. 5
Fig. 5
Optimized Protocols Improve MERFISH Performance in Long-Term Measurements of Cell Culture. (A) Images of the first (left) or last (right) hybridization round of MERFISH U-2 OS cells for the Cy5 channel run with the published protocols (top) or the optimized protocols presented here (bottom). (B) Location and identity (color) of all identified RNAs from the MERFISH measurements in (A). (C) Histogram of molecular brightness—an important quality metric for identified RNAs—for all molecules identified with the previous (blue) and optimized (red) protocols. The dashed line is the threshold used to discriminate high from low quality RNAs. (D, E) The average RNA copy number per cell for all genes versus that of another measurement for two replicate measurements with the old protocols (D) or with the optimized protocols (E). (F) The average copy number determined from the average of both MERFISH replicates with the optimized protocols (Opt.) versus that of the published protocols (Old). mRNAs are colored by the readout position score, with red indicating a readout determined by later hybridization rounds. For D, E, and F: the dashed line is equality. r represents the Pearson correlation coefficient between the logarithmic expression values.
Fig. 6
Fig. 6
Optimized Protocols Improve MERFISH Performance in Tissue Samples. (A, B) The spatial distribution of 7 out of ~ 1000 mRNAs profiled in a Swiss roll of the mouse colon using a published library and published protocols (A) or using a new library that removes high-background readout probes and the optimized protocols presented here (B). Zoom-ins are boxed. (C) mRNA abundance determined with the new library and optimized protocols as in (B) versus that measured with the published library and protocols in (A). mRNAs are colored by readout position score (Methods). (D) Distribution of the abundance of blank barcodes measured in fraction of all detected barcodes. (A, B). (E) Spatial distribution of Foxp3 (top) or Foxl1 (bottom) in the measurement in (A; left) or (B; right). All mRNAs are plotted in gray and these two mRNAs are plotted in red. For A, B: Scale bars: 1 mm.

References

    1. Zhuang, X. Spatially resolved single-cell genomics and transcriptomics by imaging. Nat. Methods. 18, 18–22 (2021). - PMC - PubMed
    1. Moffitt, J. R., Lundberg, E. & Heyn, H. The emerging landscape of spatial profiling technologies. Nat. Rev. Genet.23, 741–759 (2022). - PubMed
    1. Ke, R. et al. In situ sequencing for RNA analysis in preserved tissue and cells. Nat. Methods. 10, 857–860 (2013). - PubMed
    1. Gyllborg, D. et al. Hybridization-based in situ sequencing (HybISS) for spatially resolved transcriptomics in human and mouse brain tissue. Nucleic Acids Res.48, e112 (2020). - PMC - PubMed
    1. Lee, H., Salas, M., Gyllborg, S., Nilsson, M. & D. & Direct RNA targeted in situ sequencing for transcriptomic profiling in tissue. Sci. Rep.12, 7976 (2022). - PMC - PubMed

LinkOut - more resources