. 2025 Aug 31;16(1):1661.
doi: 10.1007/s12672-025-03497-w.

Potential role of immune-related LncRNAs in prognosis of hepatocellular carcinoma: an integrative study

Affiliations

Potential role of immune-related LncRNAs in prognosis of hepatocellular carcinoma: an integrative study

Peidong Miao et al. Discov Oncol. .

Abstract

Background: Hepatocellular carcinoma (HCC) represents a significant global health concern with persistently high incidence and mortality rates. Immune-related long non-coding RNAs (lncRNAs) may play crucial roles in the pathogenesis and progression of HCC, yet their precise mechanisms remain incompletely elucidated.

Objective: This study aims to explore the potential roles of immune-related lncRNAs in HCC patients through systematic biological approaches, integrating clinical data with bioinformatics analysis, and to construct a COX regression model for predicting patient survival.

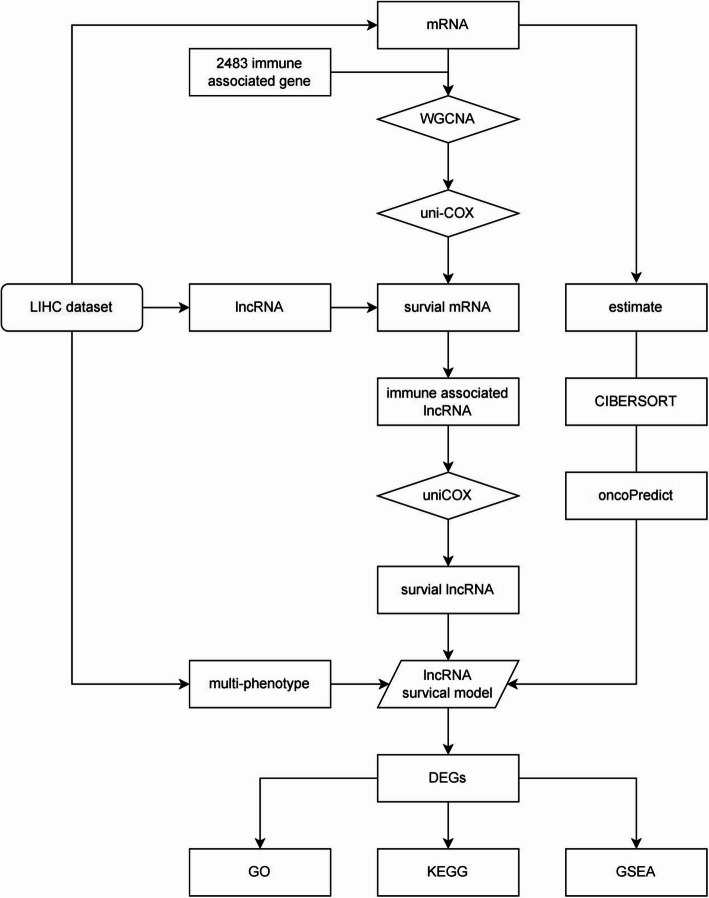
Methods: The HCC dataset from The Cancer Genome Atlas (TCGA) was utilized as the study cohort. Immune-related mRNA and lncRNA data were extracted and screened for their association with HCC patient survival using Weighted Gene Co-expression Network Analysis (WGCNA) algorithm and COX regression method. A COX regression model was subsequently established and validated.

Results: Our investigation revealed that a COX regression model comprising a group of immune-related lncRNAs and mRNAs could accurately predict patient survival in HCC. Specific analyses indicated the pivotal roles of these RNAs in the occurrence and progression of HCC, particularly in immune regulation.

Conclusions: The findings of this study underscore the critical role of immune-related lncRNAs and mRNAs in the prognosis of HCC patients, suggesting their potential as prognostic factors. This discovery provides important insights into the immune modulation mechanisms of HCC, offering novel avenues and methods for personalized therapy and prognostic assessment of HCC.

Keywords: Bioinformatics analysis; Cox regression model; Drug sensitivity; Hepatocellular carcinoma (liver cancer HCC); Immune microenvironment; Immune regulation; Immunotherapy; Long non-coding RNA (lncRNA); Survival prognosis; TCGA database (LIHC).


Conflict of interest statement

Declarations. Ethics approval and consent to participate: This study used publicly available data and did not involve human participants. Therefore, ethical approval and consent to participate were not required. Consent for publication: All authors have given their consent to publish the results of this study. Competing interests: The authors declare no competing interests.

Figures

Fig. 1
Fig. 1
Roadmap of this study
Fig. 2
Fig. 2
A Results of WGCNA calculation regarding gene modules associated with survival (survival time and survival status). Among the four gene modules, only the yellow and blue modules were significantly correlated with survival time (p < 0.05). B, C Lasso regression was employed to screen variables from 84 lncRNAs and 71 mRNAs, followed by the construction of a COX regression model. D Bar plot displaying the coefficients of the 14 RNAs comprising the model. On the y-axis, black font indicates lncRNAs, while red font indicates mRNAs. The x-axis represents coefficient values: yellow bars denote coefficients > 0, and blue bars denote coefficients < 0. E,F, G Differential expression of the 14 model-constituting RNAs between high-risk and low-risk groups in the entire dataset (E), training set (F), and validation set (G). H, I, J ROC curves predicting patient survival in the entire dataset (H), training set (I), and validation set (J). K, L, M Univariate COX regression forest plots of child pugh classification, AFP, Stage, and riskscore in the entire dataset (K), training set (L), and validation set (M). N, O, P Multivariate COX regression forest plots of child pugh classification, AFP, Stage, and riskscore in the entire dataset (N), training set (O), and validation set (P). Q Differential TMB between high-risk and low-risk groups in all LIHC patients. R, S The waterfall plot illustrates gene mutation frequency between high (R) and low-risk (S) groups. *p < 0.05; **p < 0.01; ***p < 0.001
Fig. 3
Fig. 3
A A nomogram predicting the survival of liver cancer patients based on risk score, child pugh classification, G grade, TNM stage, and vascular tumor cell type. B Consistency curves of the nomogram predicting 1-year (green line), 3-year (blue line), and 5-year (red line) survival of LIHC patients. C, D, E Clinical decision curves of the nomogram, risk score, child pugh classification, G grade, TNM stage, and vascular tumor cell type. F, G Boxplots illustrating the relationship between risk score and G grade. In Figure F, the risk score of G1 patients is significantly lower than that of G2, G3, and G4 patients (P < 0.05), while there is no significant difference in riskscore among G2, G3, and G4 patients (P > 0.05). Figure G re-demonstrates this result after combining G2, G3, and G4 patients. H, I, J, K Survival differences between high and low-risk score groups in Stage I, Stage II, Stage III, and Stage IV patients, respectively. Among Stage I patients, those with low risk scores have better survival than those with high risk scores (P < 0.05), while there is no significant difference in the remaining three stages (P > 0.05). L, M, N, O Survival differences between high and low-risk score groups in G1, G2, G3, and G4 patients, respectively. Among G2 and G3 patients, those with low risk scores have better survival than those with high risk scores (P < 0.05), while there is no significant difference in G1 and G4 patients (P > 0.05). P, Q, R Significant survival differences between high and low-risk score groups are observed in the entire dataset (P), training set (Q), and validation set (R) (P < 0.05)
Fig. 4
Fig. 4
A, B, C Differences in tumor microenvironment between high and low-risk score groups in the LIHC dataset. Specifically, the immuneScore of the low-risk score group is significantly lower than that of the high-risk group (P < 0.05), while ESTIMATEScore and StromalScore show no significant differences (P > 0.05). D Boxplot depicting differences in the abundance of 23 immune cell types predicted by CIBERSORT between high and low-risk score groups of LIHC patients. E Kaplan-Meier curves demonstrate that patients with lower Macrophage0 cell abundance have longer survival times compared to those with higher abundance (P < 0.05). F Scatter plot illustrating a positive correlation between risk score and the expression of the CD274 gene in LIHC patients (P < 0.05, R > 0). G Scatter plot showing a positive correlation between risk score and the RNAss index of hepatic cancer stem cells in HCC patients (R > 0, p < 0.05). H Violin plot of TIDE scores between high and low-risk score groups of patients. Patients in the high-risk score group are more likely to benefit from immunotherapy. I Volcano plot displaying differentially expressed genes between high and low-risk score groups. J Bubble plot presenting the top 10 GO terms with the smallest adjusted p-values enriched in differentially expressed genes. K Bar plot illustrating the top 10 KEGG terms with the smallest adjusted p-values enriched in differentially expressed genes. L Enrichment plots of the top 5 KEGG pathways enriched in the high-risk group in GSEA analysis. M Enrichment plots of the top 5 KEGG pathways enriched in the low-risk group in GSEA analysis
Fig. 5
Fig. 5
Comparison of the C-index curves of the two models. As shown in the figure, the C-index curve of our model (red) is significantly higher than that of Xu’s model (green), indicating that the consistency of our model is superior to Xu’s model

Similar articles

References

    1. Zhou M, et al. Mortality, morbidity, and risk factors in China and its provinces, 1990–2017: a systematic analysis for the global burden of disease study 2017. Lancet. 2019;394(10204):1145–58. - PMC - PubMed
    1. Li J, et al. Tumor-associated lymphatic vessel density is a postoperative prognostic biomarker of hepatobiliary cancers: a systematic review and meta-analysis. Front Immunol. 2024;15:1519999. - PMC - PubMed
    1. Li YK, et al. Portal venous and hepatic arterial coefficients predict Post-Hepatectomy overall and Recurrence-Free survival in patients with hepatocellular carcinoma: A retrospective study. J Hepatocell Carcinoma. 2024;11:1389–402. - PMC - PubMed
    1. Pinato DJ, et al. Immune-based therapies for hepatocellular carcinoma. Oncogene. 2020;39(18):3620–37. - PMC - PubMed
    1. Brady RV, Thamm DH. Tumor-associated macrophages: prognostic and therapeutic targets for cancer in humans and dogs. Front Immunol. 2023;14:1176807. - PMC - PubMed

LinkOut - more resources