

A preoperative inflammatory score-based nomogram predicts overall survival after curative hepatectomy for hepatocellular carcinoma
- PMID: 40887532
- PMCID: PMC12399463
- DOI: 10.1007/s12672-025-03406-1
A preoperative inflammatory score-based nomogram predicts overall survival after curative hepatectomy for hepatocellular carcinoma
Abstract
Objective: This study incorporated preoperative inflammatory scores to develop and validate a nomogram to predict overall survival in patients with hepatocellular carcinoma following curative resection.
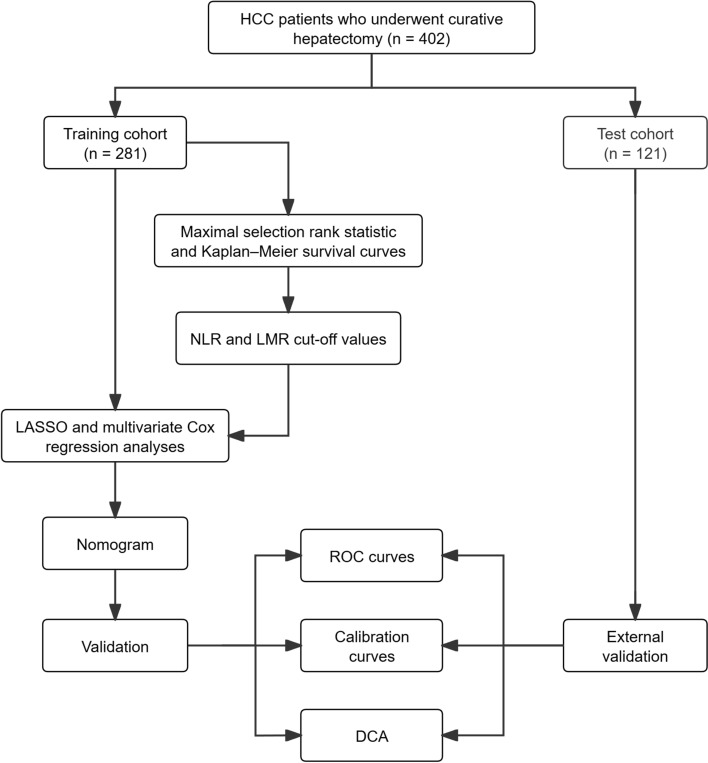
Methods: The study included 402 postoperative hepatocellular carcinoma patients, divided into training (n = 281) and test (n = 121) cohorts. Variables were analyzed using Cox proportional hazards model. The nomogram's performance was assessed using receiver operating characteristic curves, calibration curves, and decision curve analysis.
Results: Multivariable Cox proportional hazards model analysis identified neutrophil-to-lymphocyte ratio-lymphocyte-to-monocyte ratio score (HR = 4.19, 95% CI 2.47-7.12), microvascular invasion (HR = 4.93, 95% CI 2.74-8.85), and total tumor volume (HR = 1.67, 95% CI 1.03-2.68) as independent prognostic factors (P < 0.05). The nomogram exhibited excellent discriminatory ability, with area under the curve values for 12-, 36-, and 60-month overall survival in the test cohort measuring 0.941, 0.810, and 0.881. Calibration curves verified a high degree of consistency, with a Brier score of 0.054, 0.120, and 0.102, between the predicted and observed survival probabilities in the test cohort. Decision curve analysis confirmed clinical utility across a wide threshold probability range (0.15-0.70).
Conclusion: The nomogram integrating neutrophil-to-lymphocyte ratio-lymphocyte-to-monocyte ratio score, microvascular invasion, and total tumor volume effectively identifies high-risk hepatocellular carcinoma patients with shorter overall survival. This tool provides clinicians with new evidence for risk-stratified interventions.
Keywords: Hepatectomy; Hepatocellular carcinoma; Inflammation indices; Nomogram; Overall survival; Prediction model.
© 2025. The Author(s).
Conflict of interest statement
Declarations. Ethics approval and consent to participate: The studies involving humans were approved by Ethical Review Committee of the First Hospital of Jilin University (2025-169) and conform to the Declaration of Helsinki. The studies were conducted in accordance with the local legislation and institutional requirements. Informed consent to participate was obtained from all individual participants included in the study. Consent to publications: All authors have reviewed and approved the final version of the manuscript. Competing interests: The authors declare no competing interests.
Figures


Similar articles
-
Comparison of Two Modern Survival Prediction Tools, SORG-MLA and METSSS, in Patients With Symptomatic Long-bone Metastases Who Underwent Local Treatment With Surgery Followed by Radiotherapy and With Radiotherapy Alone.Clin Orthop Relat Res. 2024 Dec 1;482(12):2193-2208. doi: 10.1097/CORR.0000000000003185. Epub 2024 Jul 23. Clin Orthop Relat Res. 2024. PMID: 39051924
-
Are Current Survival Prediction Tools Useful When Treating Subsequent Skeletal-related Events From Bone Metastases?Clin Orthop Relat Res. 2024 Sep 1;482(9):1710-1721. doi: 10.1097/CORR.0000000000003030. Epub 2024 Mar 22. Clin Orthop Relat Res. 2024. PMID: 38517402 Free PMC article.
-
Does the Presence of Missing Data Affect the Performance of the SORG Machine-learning Algorithm for Patients With Spinal Metastasis? Development of an Internet Application Algorithm.Clin Orthop Relat Res. 2024 Jan 1;482(1):143-157. doi: 10.1097/CORR.0000000000002706. Epub 2023 Jun 12. Clin Orthop Relat Res. 2024. PMID: 37306629 Free PMC article.
-
Clinical diagnostic and prognostic value of homocysteine combined with hemoglobin [f (Hcy-Hb)] in cardio-renal syndrome caused by primary acute myocardial infarction.J Transl Med. 2025 Jul 23;23(1):813. doi: 10.1186/s12967-025-06512-4. J Transl Med. 2025. PMID: 40702542 Free PMC article.
-
Construction of a clinical prediction model for overall survival and cancer-specific survival in malignant phyllode tumor of the breast based on the SEER database.Discov Oncol. 2025 Jul 1;16(1):1200. doi: 10.1007/s12672-025-03024-x. Discov Oncol. 2025. PMID: 40591139 Free PMC article.
References
-
- Sung H, et al. Global cancer statistics 2020: GLOBOCAN estimates of incidence and mortality worldwide for 36 cancers in 185 countries. CA Cancer J Clin. 2021;71(3):209–49. - PubMed
-
- Siegel RL, et al. Cancer statistics, 2022. CA Cancer J Clin. 2022;72(1):7–33. - PubMed
-
- Bray F, et al. Global cancer statistics 2022: GLOBOCAN estimates of incidence and mortality worldwide for 36 cancers in 185 countries. CA Cancer J Clin. 2024;74(3):229–63. - PubMed
-
- European Association for the Study of the Liver. Electronic, a and easloffice@easloffice.eu, EASL Clinical Practice Guidelines: Liver transplantation. J Hepatol, 2016. 64(2): p. 433–485. 10.1016/j.jhep.2015.10.006.org/abc - PubMed
-
- Tabrizian P. Recurrence of hepatocellular cancer after resection: Patterns, treatments, and prognosis. Ann Surg. 2015. 10.1097/SLA.0000000000000710. - PubMed
Grants and funding
LinkOut - more resources
Full Text Sources