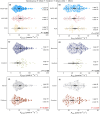
Environmental factors have a greater influence on photosynthetic capacity in C4 plants than biochemical subtypes or growth forms
- PMID: 40887880
- PMCID: PMC12489297
- DOI: 10.1111/nph.70525
Environmental factors have a greater influence on photosynthetic capacity in C4 plants than biochemical subtypes or growth forms
Abstract
Our understanding of how photosynthetic capacity varies among C4 species and across growth and measurement conditions remains limited. We collated 1696 CO2 response curves of net CO2 assimilation rate (A/Ci curves) from C4 species grown and measured at various environmental conditions and used these data to estimate the apparent maximum carboxylation activity of phosphoenolpyruvate carboxylase (VpmaxA) and CO2-saturated net photosynthetic rate (Amax), two key parameters describing photosynthetic capacity. We examined how VpmaxA and Amax vary with species-specific traits, growth and measurement conditions. We found little systematic variation of VpmaxA and Amax across the classical C4 biochemical subtypes or growth forms, but showed that growth temperature and measurement conditions are major factors determining C4 photosynthetic capacity. We found no evidence that common C4 model species (e.g. maize, sorghum and Setaria viridis) differ in photosynthetic capacity from other C4 species when grown in controlled environments. However, C4 model species showed up to twice the photosynthetic capacity of other C4 species when grown in the field. Our multivariate model accounts for 47-51% of the variation reported in VpmaxA and Amax, and we argue that environmental conditions have a greater influence on C4 photosynthetic capacity than biochemical subtypes or growth forms.
Keywords: A/Ci curve; Amax; C4 biochemical subtype; C4 photosynthesis; Vpmax; environmental response; photosynthesis modelling.
© 2025 The Author(s). New Phytologist © 2025 New Phytologist Foundation.
Conflict of interest statement
None declared.
Figures


References
-
- Anderson LJ, Maherali H, Johnson HB, Polley HW, Jackson RB. 2001. Gas exchange and photosynthetic acclimation over subambient to elevated CO2 in a C3–C4 grassland. Global Change Biology 7: 693–707.
-
- Arena C, Vitale L, De Santo AV. 2011. Influence of irradiance on photosynthesis and PSII photochemical efficiency in maize during short‐term exposure at high CO2 concentration. Photosynthetica 49: 267–274.
-
- Arrivault S, Alexandre Moraes T, Obata T, Medeiros DB, Fernie AR, Boulouis A, Ludwig M, Lunn JE, Borghi GL, Schlereth A et al. 2019. Metabolite profiles reveal interspecific variation in operation of the Calvin–Benson cycle in both C4 and C3 plants. Journal of Experimental Botany 70: 1843–1858. - PMC - PubMed
-
- Atkin OK, Tjoelker MG. 2003. Thermal acclimation and the dynamic response of plant respiration to temperature. Trends in Plant Science 8: 343–351. - PubMed
-
- Bauwe H. 1986. An efficient method for the determination of Km values for HCO3 − of phosphoenolpyruvate carboxylase. Planta 169: 356–360. - PubMed
MeSH terms
Substances
Grants and funding
- DE-SC0018420/U.S. Department of Energy, Office of Science, Biological and Environmental Research Program
- D.A.W/The Australian National University Futures Scheme
- 10908/Carnegie Venture Grant
- DBI-2213983/National Science Foundation
- IOS-1546838/National Science Foundation
- IOS-2312181/National Science Foundation
- IOS-2406533/National Science Foundation
- MCB-1617020/National Science Foundation
- OISE-2434687/National Science Foundation
- NE/W00674X/1/Natural Environment Research Council
- 20-07-0232/John Wesley Powell Center for Analysis and Synthesis, U.S. Geological Survey
- DE-SC0008769/U.S. Department of Energy, Office of Science, Office of Biological and Environmental Research, Genomic Science Program
- DE-SC0018277/U.S. Department of Energy, Office of Science, Office of Biological and Environmental Research, Genomic Science Program
- DE-SC0020366/U.S. Department of Energy, Office of Science, Office of Biological and Environmental Research, Genomic Science Program
- DE-SC0021286/U.S. Department of Energy, Office of Science, Office of Biological and Environmental Research, Genomic Science Program
- DE-SC0023160/U.S. Department of Energy, Office of Science, Office of Biological and Environmental Research, Genomic Science Program
- DP180102747/Australian Research Council
- DP230103122/Australian Research Council
- FL190100003/Australian Research Council
- FT220100276/Australian Research Council
LinkOut - more resources
Full Text Sources
Miscellaneous

