. 2025 Sep;117(9):e70032.
doi: 10.1111/boc.70032.

DeepSCEM: A User-Friendly Solution for Deep Learning-Based Image Segmentation in Cellular Electron Microscopy

Affiliations

DeepSCEM: A User-Friendly Solution for Deep Learning-Based Image Segmentation in Cellular Electron Microscopy

Cyril Meyer et al. Biol Cell. 2025 Sep.

Abstract

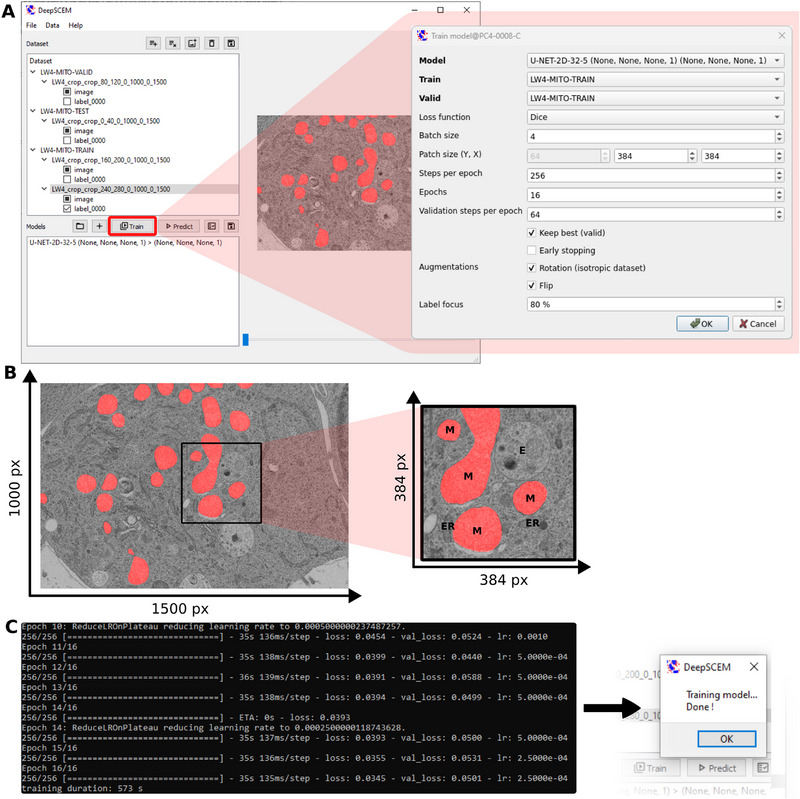
Deep learning methods using convolutional neural networks are very effective for automatic image segmentation tasks with no exception for cellular electron micrographs. However, the lack of dedicated easy-to-use tools largely reduces the widespread use of these techniques. Here we present DeepSCEM, a straightforward tool for fast and efficient segmentation of cellular electron microscopy images using deep learning with a special focus on efficient and user-friendly generation and training of models for organelle segmentation.

Keywords: cellular imaging; deep learning; electron microscopy; organelles; segmentation; software.


Conflict of interest statement

The authors declare that they have no conflict of interest.

Figures

Figure 1
Figure 1
General workflow of the DeepSCEM application. Images along with one or multiple labels (binary mask files) are loaded into DeepSCEM through its user interface. Each combination of image and labels composes a sample. Existing compatible model can be directly trained. New models can be created and configured by the user for training. The model is used to generate a segmentation prediction that can be evaluated or validated through the user interface.
Figure 2
Figure 2
Loading and browsing datasets within the DeepSCEM graphical user interface (GUI). (A) hdf5 based dataset can be uploaded using the icon highlighted in red and is visible in the “dataset” section of the GUI (Red arrow). Here, a complete dataset is highlighted in red. Datasets in DeepSCEM are structured as follows, the dataset name is first displayed. Each dataset can contain multiple samples representing different regions of interest (ROI) of a volumetric image stack. Here, the dataset entitled “LW4‐MITO‐TRAIN” has two samples named “LW4_crop_crop_160_[…]” and “LW4_crop_crop_240_[…]”, respectively. Each sample is composed of at least a stack of EM volumetric images. Presently, the sample “LW4_crop_crop_160_[…]” is composed of a stack of EM images named “image” and a set of binary masks of segmented mitochondria named “label_0000”. Datasets can be visualized and browsed by moving the blue thumb of the scrolling bar framed in black at the bottom of the screen. (B) The sample “LW4_crop_crop_240_[…]” labels are shown: the “image” label shows an EM micrograph and the “image + label_0000” shows the superimposition of the “image” and “label_0000” labels highlighting the segmentation of mitochondria. Images have been annotated, M stands for mitochondria, E, endosomes, ER, endoplasmic reticulum.
Figure 3
Figure 3
Creation of a starting model. (A) Upon selection of the red framed “+” icon, a starting model can be set up and loaded into the DeepSCEM GUI. The zoomed frame shows the deep learning network parameters used to create a starting model. The values shown here are displayed by default as they gave good results when used for both user cases. (B) The newly created model is listed in the “Models” section of the DeepSCEM GIU (red frame). The model dimension, the number of initial block filters as well as the model depth are reported in the model name. As it stands, this initial model would give poor segmentation prediction because it has not been trained.
Figure 4
Figure 4
Prediction model training. (A) Newly created models or compatible ones uploaded to the DeepSCEM GUI can be trained using the red framed “train” icon. This will open a new window (see the zoomed frame) giving access to the training configuration. There, the training “Model” with the “Train” and “Valid” datasets have to be selected accordingly. “Batch size” and “Patch size” have to be balanced depending on the image pixel size, the image features size (such as organelles) and the computer memory available. The number of “epochs” correspond to the number of times the complete dataset was used by DeepSCEM learning algorithm during training. The “steps per epochs” are the number of batches used to train on the complete dataset and the number of “validation per epoch” are the batches used to compute the validation (val_loss) at the end of each epoch. The “keep best” option saves the version of the model with the lowest val_loss. The “early stopping” option stops the training of a model that doesn't improve based on the losses. The “rotation” and “flip” are data augmentation options that increase the variability of the training dataset. The “label focus” option biases the randomness of the patches extraction resulting in a training dataset composed of a desired proportion of segmented patches, here 80%. (B) Illustration of a patch size of 384 × 384 pixel2 (xy) extracted from a section of a 3D stack of 1500 × 1000 × 600 pixel3 (xyz). The magnified image on the right panel shows a 2D patch of 384 × 384 pixel2 with a pixel size of 7.5 nm, sufficient to extract multiple instances of mitochondria (M), endosomes (E), or endoplasmic reticulum (ER). (C) left panel: Training losses as well as the learning rate (displayed as “lr”) are shown within the terminal as soon as the training starts and are updated after each completed epoch. The progression of the training can be appreciated by comparing the losses of older epochs to new ones. B right panel: The user is informed of the end of the training by a pop‐up window on the main GUI.
Figure 5
Figure 5
Segmentation prediction and evaluation. (A) The red framed “predict” icon on the main GUI gives access to the prediction parameters window. “Model” and “Dataset” entries have to be selected accordingly and the patch size has to be set up depending on the size of the stack to be segmented and the computer memory. The prediction progression can be followed in the terminal. The user is informed that the prediction ended by a pop‐up on the main GUI. (B) The dataset loaded for segmentation and its prediction can be both visualized within DeepSCEM GUI upon selection. The title of the predicted segmentation sample contains an added “pred” mention (see the red stroke). (C) The button with the mark symbol framed in red gives access to the evaluation windows. “Reference” loaded dataset and “Segmentation” predicted datasets have to be selected accordingly as well as the metrics wanted. F1 and/or IoU scores are then calculated and displayed.
Figure 6
Figure 6
Qualitative segmentation predictions. (A) Reference segmentation of mitochondria (red), endoplasmic reticulum (green), endosomes (pink), and plasma membrane (blue). (B) Mitochondria segmentation prediction using a binary model. (C) Mitochondria and endoplasmic reticulum segmentation predictions using a model trained on two classes. (D) Mitochondria, endosomes, and plasma membrane segmentation predictions using a model trained on three classes.
Figure 7
Figure 7
Gallery of endosomes and lysosomes that form a very heterogeneous class of organelles that have a different appearance according to their origin and maturation stage.

Similar articles

References

    1. Belevich, I. , Joensuu M., Kumar D., Vihinen H., and Jokitalo E.. 2016. “Microscopy Image Browser: A Platform for Segmentation and Analysis of Multidimensional Datasets.” PLOS Biology 14, no. 1: e1002340. 10.1371/journal.pbio.1002340. - DOI - PMC - PubMed
    1. Belevich, I. , and Jokitalo E.. 2021. “DeepMIB: User‐Friendly and Open‐Source Software for Training of Deep Learning Network for Biological Image Segmentation.” PLOS Computational Biology 17, no. 3: e1008374. 10.1371/journal.pcbi.1008374. - DOI - PMC - PubMed
    1. Berg, S. , Kutra D., Kroeger T., et al. 2019. “ilastik: Interactive Machine Learning for (Bio)Image Analysis.” Nature Methods 16, no. 12: 1226–1232. 10.1038/s41592-019-0582-9. - DOI - PubMed
    1. Bosch, C. , Martínez A., Masachs N., et al. 2016. “Erratum: FIB/SEM Technology and High‐Throughput 3D Reconstruction of Dendritic Spines and Synapses in GFP‐Labeled Adult‐Generated Neurons.” Frontiers in Neuroanatomy 10: 100. 10.3389/fnana.2016.00100. - DOI - PMC - PubMed
    1. Chaurasia, A. , and Culurciello E.. 2017. “LinkNet: Exploiting Encoder Representations for Efficient Semantic Segmentation.” 2017 IEEE Visual Communications and Image Processing (VCIP) , 1–4. 10.1109/VCIP.2017.8305148. - DOI

MeSH terms

LinkOut - more resources