. 2025 Aug 27;53(16):gkaf841.
doi: 10.1093/nar/gkaf841.

SMAD3 and p300 complex scaffolding by long non-coding RNA LIMD1-AS1 promotes TGF-β-induced breast cancer cell plasticity

Affiliations

SMAD3 and p300 complex scaffolding by long non-coding RNA LIMD1-AS1 promotes TGF-β-induced breast cancer cell plasticity

Chuannan Fan et al. Nucleic Acids Res. .

Abstract

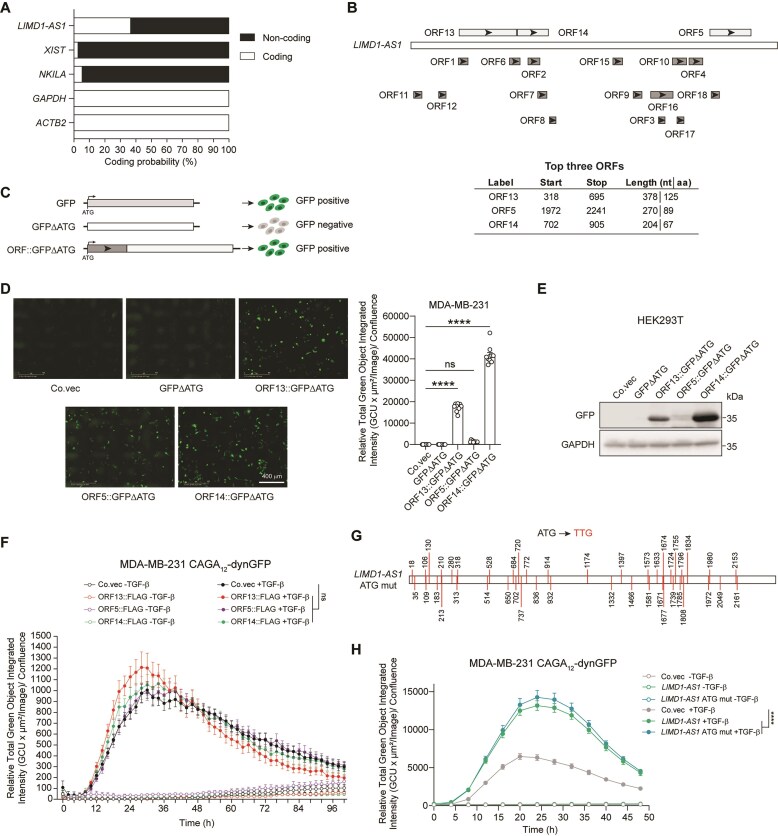
Transforming growth factor (TGF)-β signaling enhances cancer cell plasticity by inducing epithelial-to-mesenchymal transition (EMT). Here, we identified a TGF-β-induced long non-coding RNA, LIMD1 Antisense RNA 1 (LIMD1-AS1) that strengthens the SMAD-mediated transcriptional response to TGF-β. LIMD1-AS1 expression is upregulated in breast cancer tissues compared to normal breast tissues, and high LIMD1-AS1 expression is associated with poor prognosis in breast cancer patients. Depletion of LIMD1-AS1 hinders TGF-β-induced EMT, migration, and extravasation of breast cancer cells. Mechanistically, LIMD1-AS1 promotes the interaction between SMAD3 and its transcriptional coactivator p300, thereby enhancing SMAD3 transcriptional activity and TGF-β/SMAD signaling. We demonstrated that LIMD1-AS1 binds to the MAD homology 2 (MH2) domain of SMAD3 and the interferon-binding domain (IBiD) of p300. Displacing LIMD1-AS1 from p300 by its competitor interferon regulatory factor 3 (IRF3) suppressed the effects of LIMD1-AS1 on potentiating TGF-β/SMAD signaling. Furthermore, blockage of p300 acetyltransferase activity with a pharmacological inhibitor A-485 reduced the ability of LIMD1-AS1 to enhance SMAD3 transcriptional activity, TGF-β-induced EMT, and migration. This study identifies LIMD1-AS1 as a novel stimulator of TGF-β signaling by establishing a positive feedback loop and highlights its potential as a therapeutic target for breast cancer.


Conflict of interest statement

None declared.

Figures

Graphical Abstract
Graphical Abstract
Figure 1.
Figure 1.
A CRISPRi screen identifies LIMD1-AS1 as a TGF-β signaling enhancer. (A) Schematic overview of the selection of 107 TGF-β-induced lncRNAs in MDA-MB-231 cells. (B) Schematic overview of the CRISPRi-mediated lncRNA screen in MDA-MB-231 cells using the (CAGA)12-green fluorescent protein (GFP) SMAD3/SMAD4-dependent transcriptional reporter. (C) Diagram of lncRNA screening results in MDA-MB-231 cells. LncRNAs promoting TGF-β-induced (CAGA)12-GFP reporter activity are indicated in purple, and SMAD3 is indicated in yellow. The x- and y-axes represent the −log10 transformation of the positive robust ranking aggregation (RRA) scores comparing the GFP-high population to the GFP-low population in two replicates. The dashed line indicates the cutoff of −log10 (RRA score) at 1.5. (D-F) Reverse transcription quantitative polymerase chain reaction (RT-qPCR) of LIMD1-AS1 expression in MDA-MB-231 (D), MCF10A-M1 (E), and MCF10A-M2 (F) cells upon TGF-β stimulation for the indicated durations. The results are expressed as the mean ± SEM values from three biological replicates. Significance was calculated using one-way ANOVA followed by Dunnett’s multiple comparisons test. (G) Subcellular localization analysis of LIMD1-AS1 in MDA‐MB‐231 cells by RT-qPCR. NEAT1 is a positive control for the nuclear fraction, whereas H19 and GAPDH are positive controls for the cytoplasmic fraction. The data are presented as the mean ± SEM from three biological replicates. (H) RNA fluorescence in situ hybridization was performed to evaluate LIMD1-AS1 expression and subcellular localization in MDA-MB-231 cells. Representative images are shown in the left panel, and signal quantification data are shown in the right panel. Scale bar = 4.64 μm. The results from 28 (−TGF-β) and 20 (+TGF-β) cells are quantified as a box plot with min-to-max whiskers using unpaired Student’s t-test. (I) Schematic working model. TGF-β induces the expression of LIMD1-AS1, which promotes the TGF-β-induced transcriptional response. *0.01 < P < 0.05; ***0.001 < P < 0.01; ***0.0001 < P < 0.001; ****P < 0.0001.
Figure 2.
Figure 2.
LIMD1-AS1 promotes TGF-β signaling independent of its coding potential. (A) Coding probability prediction of LIMD1-AS1 with the CPAT software. Protein‐coding mRNA (GAPDH and ACTB2) and well‐annotated lncRNAs (XIST and NKILA) serve as positive controls. (B) ORF analysis of LIMD1-AS1 sequence by using the ORF Finder tool from NCBI. Information on the top three ORFs is presented in the table, while details for the remaining ORFs are provided in Supplementary Table S3. (C) Schematic representation of the GFP reporter used to determine the coding potential of ORFs from LIMD1-AS1. (D) Representative images of MDA-MB-231 cells stably expressing LIMD1-AS1 ORFs fused to GFP without the start codon (ΔATG). Co.vec, control empty vector. Scale bar = 400 μm. Signal quantification data are shown in the right panel. Significance was assessed using one-way ANOVA followed by Dunnett’s multiple comparisons test. (E) Western blotting analysis of the expression of LIMD1-AS1 ORFs fused to GFPΔATG in HEK293T cells. GAPDH, loading control. Co.vec, control empty vector. (F) Effect of FLAG-tagged LIMD1-AS1 ORFs on GFP intensity in MDA-MB-231 cells expressing the CAGA12-dynGFP reporter. The results are expressed as mean ± SEM from four biological replicates. Significance was assessed using two-way ANOVA followed by Tukey’s multiple comparisons test. Co.vec, control empty vector. (G) Schematic representation of the LIMD1-AS1 mutant with all 44 ATGs mutated to TTGs (LIMD1-AS1 ATG mut). (H) Effect of ectopic expression of LIMD1-AS1 or LIMD1-AS1 ATG mut on GFP intensity in MDA-MB-231 cells expressing the CAGA12-dynGFP reporter. The results are expressed as mean ± SD from nine biological replicates. Significance was assessed using two-way ANOVA followed by Tukey’s multiple comparisons test. Co.vec, control empty vector. ****P < 0.0001; ns, not significant.
Figure 3.
Figure 3.
LIMD1-AS1 expression is correlated with poor prognosis in breast cancer patients. (A) Comparison of LIMD1-AS1 expression between normal breast tissues (Normal) and breast cancer samples (Tumor) from the TCGA dataset. The results are expressed as the mean ± SEM. Significance was assessed using unpaired Student’s t-test. (B) Comparison of LIMD1-AS1 expression between normal breast tissues (Normal) and breast cancer samples (Tumor) from the TCGA and GTEx datasets. The data were generated via Gene Expression Profiling Interactive Analysis (GEPIA)2 [85]. (C) Quantification of LIMD1-AS1 expression by in situ hybridization in a breast cancer tissue microarray. Representative images (bar = 200 μm) and zoomed images (bar = 50 μm) of in situ hybridization results in breast cancer and matched adjacent normal tissues are shown in the left panel. The comparison of the LIMD1-AS1 staining index between the paired tissues is shown in the right panel. Tissue pairs with higher LIMD1-AS1 expression in the normal tissue than that in the breast cancer tissue are highlighted in green, whereas tissue pairs with lower LIMD1-AS1 expression in the normal tissue than that in the tumor tissue are highlighted in red. Significance was assessed using paired t-test. (D) Quantification of LIMD1-AS1 expression by in situ hybridization in breast cancer tissue microarrays comprising breast cancer samples with different N stages. Significance was assessed using one-way ANOVA followed by Tukey’s multiple comparisons test. (E, F) Kaplan–Meier survival curves in breast cancer patients stratified by LIMD1-AS1 expression. The data in panels (E) and (F) were generated via R2 Genomics Analysis and Visualization Platform (http://r2.amc.nl) and Kaplan–Meier Plotter [86, 87] (https://kmplot.com/analysis/), respectively. *0.01 < P < 0.05; ****P < 0.0001.
Figure 4.
Figure 4.
LIMD1-AS1 promotes TGF-β/SMAD signaling. (A, C)The efficiency of CRISPRa-mediated LIMD1-AS1 overexpression (A) and Cas13d-mediated LIMD1-AS1 knockdown (C) with two independent gRNAs in MDA-MB-231 cells. gEV, empty vector for gRNA expression. The data are shown as mean ± SEM (A) and mean ± SD (C) from three biological replicates. Significance was assessed using two-way ANOVA followed by Šídák’s multiple comparisons test. (B, D) Effect of CRISPRa-mediated LIMD1-AS1 overexpression (B) and Cas13d-mediated LIMD1-AS1 knockdown (D) with two independent gRNAs on GFP intensity in MDA-MB-231 cells expressing the CAGA12-dynGFP reporter. The results are expressed as mean ± SEM from nine (B) and four (D) biological replicates. Significance was assessed using two-way ANOVA followed by Dunnett’s multiple comparisons test. gEV, empty vector for gRNA expression. (E, F) Effect of CRISPRa-mediated LIMD1-AS1 overexpression (E) and Cas13d-mediated LIMD1-AS1 knockdown (F) with two independent gRNAs on TGF-β-induced PAI-1 and SMAD7 expression in MDA-MB-231 cells. RT-qPCR results are shown as mean ± SEM (E) and mean ± SD (F) from three biological replicates. Significance was assessed using two-way ANOVA followed by Šídák’s multiple comparisons test. gEV, empty vector for gRNA expression. (G) Correlation between LIMD1-AS1 expression and TGF-β response gene signature in TCGA breast cancer samples. The data were generated via R2 Genomics Analysis and Visualization Platform (http://r2.amc.nl). The statistical analysis was performed using Pearson’s correlation (r) test. (H-J) Effect of CRISPRa-mediated LIMD1-AS1 overexpression (H), Cas13d-mediated LIMD1-AS1 knockdown (I), and LIMD1-AS1 ectopic expression (J) on TGF-β-induced SMAD2 phosphorylation (p-SMAD2) in MDA-MB-231 cells. The p-SMAD2 and total SMAD2 (t-SMAD2) levels were analyzed by western blotting. GAPDH, loading control. Co.vec and gEV, control empty vectors. *0.01 < P < 0.05; **0.001 < P < 0.01; ***0.0001 < P < 0.001; ****P < 0.0001; ns, not significant.
Figure 5.
Figure 5.
LIMD1-AS1 enhances TGF-β-induced EMT, migration, and extravasation. (A, C) Efficiency of LIMD1-AS1 ectopic expression (A) and Cas13d-mediated LIMD1-AS1 knockdown (C) in MCF10A-M2 cells. Co.vec and gEV, control empty vectors. RT-qPCR results are shown as mean ± SD from three independent experiments (A) and three biological replicates (C). Significance was assessed using two-way ANOVA followed by Šídák’s multiple comparisons test. (B, D) Effect of LIMD1-AS1 on TGF-β-induced EMT marker expression in MCF10A-M2 cells upon LIMD1-AS1 ectopic expression (B) and Cas13d-mediated LIMD1-AS1 knockdown (D). GAPDH, loading control. Co.vec and gEV, control empty vectors. (E) Immunofluorescence analysis of F-actin expression and localization in A549 cells upon CRISPRa-mediated LIMD1-AS1 overexpression with two independent gRNAs. Scale bar = 36.8 μm. gEV, empty vector for gRNA expression. Quantification results of the relative F-actin fluorescence intensity are shown as mean ± SD from three biological replicates. Significance was assessed using two-way ANOVA followed by Dunnett’s multiple comparisons test. (F) Correlation between LIMD1-AS1 expression and EMT gene signature in TCGA breast cancer samples. The data were generated via R2 Genomics Analysis and Visualization Platform (http://r2.amc.nl). The statistical analysis was performed using Pearson’s correlation (r) test. (G) Schematic representation of the transwell migration assay. (H, I) Effect of LIMD1-AS1 on TGF-β-induced migration in MDA-MB-231 cells as analyzed by a transwell migration assay. LIMD1-AS1 overexpression was achieved by ectopic expression (H), and LIMD1-AS1 knockdown was achieved by Cas13d-mediated knockdown (I). Co.vec and gEV, control empty vectors. The results are expressed as mean ± SEM (H) and mean ± SD (I) from 16 (H) and 6 (I) biological replicates, respectively. Significance was calculated using two-way ANOVA followed by Tukey’s multiple comparisons test. (J) Schematic representation of the zebrafish embryo xenograft assay. (K) In vivo zebrafish xenograft experiments with mCherry-labelled MDA-MB-231 cells upon Cas13d-mediated LIMD1-AS1 knockdown. Representative zoomed images of the tail fin area are shown in the left panel. Extravasated breast cancer cell clusters are indicated with yellow arrows. gEV, empty vector for gRNA expression. Analysis of the extravasated cell cluster numbers is expressed as mean in the right panel. Significance was assessed using one-way ANOVA followed by Dunnett’s multiple comparisons test. Whole zebrafish image, bar = 618.8 μm; zoomed image, bar = 154.7 μm. *0.01 < P < 0.05; **0.001 < P < 0.01; ***0.0001 < P < 0.001; ****P  < 0.0001.
Figure 6.
Figure 6.
LIMD1-AS1 binds and enhances SMAD3 transcriptional activity. (A) The interactions between LIMD1-AS1 and SMAD proteins in HEK293T cells were analyzed by RIP. RT-qPCR was performed to detect LIMD1-AS1 expression in immunoprecipitates and input. The results are expressed as the mean ± SEM from three biological replicates, and significance was assessed using two-way ANOVA followed by Šídák’s multiple comparisons test. (B) Schematic representation of full-length (FL) SMAD3 and the truncation mutants tested. (C) Western blotting was used to analyze the expression of SMAD3 and its truncation mutants in HEK293T cells. Vinculin, loading control. (D) The interactions between LIMD1-AS1 and SMAD3 and its truncation mutants in HEK293T cells were analyzed by RIP. RT-qPCR was performed to detect LIMD1-AS1 expression in immunoprecipitates and input. The results are expressed as the mean ± SEM from three biological replicates, and significance was assessed using two-way ANOVA followed by Šídák’s multiple comparisons test. (E) Schematic representation of the luciferase reporter to examine the transcriptional activity of SMAD3. UAS, upstream activating sequence; DBD, DNA binding domain. (F, G) Effect of LIMD1-AS1 on the transcriptional activity of GAL4-DBD-SMAD3 and GAL4-DBD-SMAD3-ΔMH1 (F), as well as GAL4-DBD-SMAD2/3/4-ΔMH1 (G), as determined by luciferase reporter assays. The data are presented as the mean ± SD from three biological replicates. Significance was assessed using one-way ANOVA followed by Tukey’s multiple comparisons test. (H) ChIP-qPCR analysis of the effect of LIMD1-AS1 on SMAD3 binding to the promoter of PAI-1, SMAD7, and SNAI1 in MDA-MB-231 cells. The results are expressed as the mean ± SD from three biological replicates. Significance was assessed using two-way ANOVA followed by Šídák’s multiple comparisons test. **0.001 < P < 0.01; ****P < 0.0001; ns, not significant.
Figure 7.
Figure 7.
LIMD1-AS1 promotes p300–SMAD3 interaction. (A, B) Sequential co-IP experiments to confirm the formation of SMAD3/p300/LIMD1-AS1 ternary complex in HEK293T cells. Western blotting analysis (A) was performed to detect MYC and FLAG expression in whole-cell lysates (Input) and immunoprecipitates (IP). GAPDH, loading control. RT-qPCR was subsequently performed to assess LIMD1-AS1 expression in the IP samples (B). The results are shown as mean ± SEM from three biological replicates. Significance was assessed using two-way ANOVA followed by Šídák’s multiple comparisons test. (C) The interaction between p300 and SMAD3 upon LIMD1-AS1 ectopic expression was analyzed by co-IP assays in HEK293T cells. Western blotting analysis was performed to detect MYC and FLAG expression in the input and IP samples. Vinculin, loading control. (D) The endogenous interaction between p300 and SMAD3 was evaluated by PLA in MDA-MB-231 cells. The red and blue dots indicate the p300–SMAD3 interaction and the staining of nuclei by DAPI, respectively. Scale bar = 9.2 μm. The quantification of the PLA signal is shown in the right panel. Significance was assessed using one-way ANOVA followed by Tukey’s multiple comparisons test. (E) The interaction between LIMD1-AS1 and MYC-tagged p300 in HEK293T cells, which was analyzed by RIP. RT-qPCR was performed to detect LIMD1-AS1 expression in input and IP samples. The results are expressed as the mean ± SD from three biological replicates, and significance was assessed using unpaired Student’s t-test. (F) The interaction between LIMD1-AS1 and its truncation mutants and FLAG-p300 or 6xMYC-SMAD3 in MDA-MB-231 cells was analyzed by RNA pull-down. LIMD1-AS1 antisense RNA (LIMD1-AS1-AS) and LETS1 lncRNA were used as negative controls. Western blotting analysis was performed to detect FLAG and MYC expression in the input and IP samples. The RNA amounts used for pull-down were evaluated by agarose gel electrophoresis. (G) Schematic representation of the p300 truncation mutants. (H) The interactions between LIMD1-AS1 and the p300 truncation mutants in HEK293T cells were analyzed by RIP. RT-qPCR was performed to detect LIMD1-AS1 expression in immunoprecipitates and input. The results are expressed as the mean ± SEM from three biological replicates, and significance was assessed using two-way ANOVA followed by Šídák’s multiple comparisons test. (I) The effect of IRF3-5SD on the interaction between LIMD1-AS1 and FLAG-p300-IBiD in HEK293T cells were analyzed by RIP. RT-qPCR was performed to detect LIMD1-AS1 expression in immunoprecipitates and input. The results are expressed as the mean ± SEM from three independent experiments, and significance was assessed using two-way ANOVA followed by Šídák’s multiple comparisons test. (J) Effect of IRF3-5SD on LIMD1-AS1-induced GAL4-DBD-SMAD3 transcriptional activity in HEK293T cells, as determined by luciferase reporter assays. The data are presented as the mean ± SD from three biological replicates. Significance was assessed using one-way ANOVA followed by Tukey’s multiple comparisons test. (K) Effect of IRF3-5SD on TGF-β/SMAD-induced transcriptional activity, which was enhanced by LIMD1-AS1, in HEK293T cells with a CAGA12 luciferase transcriptional reporter. The data are presented as the mean ± SD from three biological replicates. Significance was assessed using one-way ANOVA followed by Tukey’s multiple comparisons test. *0.01 < P < 0.05; **0.001 < P < 0.01; ***0.0001 < P < 0.001; ****P < 0.0001.
Figure 8.
Figure 8.
p300 inhibition suppresses LIMD1-AS1-induced promotion of SMAD3 transcriptional activity and TGF-β/SMAD signaling. (A) Effect of A-485 (p300 inhibitor) or PCAF-IN-2 (PCAF inhibitor) on LIMD1-AS1-induced GAL4-DBD-SMAD3 transcriptional activity in HEK293T cells, as determined by luciferase reporter assays. The data are presented as the mean ± SD from three biological replicates. Significance was assessed using one-way ANOVA followed by Tukey’s multiple comparisons test. (B) Effect of E1A on LIMD1-AS1-induced GAL4-DBD-SMAD3 transcriptional activity in HEK293T cells, as determined by luciferase reporter assays. The data are presented as the mean ± SD from three biological replicates. Significance was assessed using one-way ANOVA followed by Tukey’s multiple comparisons test. (C) Effect of A-485 on LIMD1-AS1-induced GAL4-DBD-SMAD3-ΔMH1 transcriptional activity in HEK293T cells, as determined by luciferase reporter assays. The data are presented as the mean ± SD from three biological replicates. Significance was assessed using one-way ANOVA followed by Tukey’s multiple comparisons test. (D) Effect of A-485 on the TGF-β/SMAD-induced transcriptional activity, which was enhanced by LIMD1-AS1, in HEK293T cells with a CAGA12 luciferase reporter. The data are presented as the mean ± SD from three biological replicates. Significance was assessed using one-way ANOVA followed by Tukey’s multiple comparisons test. (E) Effect of A-485 on TGF-β-induced PAI-1, CTGF, and IL-11 expression, which was increased upon LIMD1-AS1 ectopic expression, in MDA-MB-231 cells. RT-qPCR results are shown as mean ± SD from three biological replicates. Significance was assessed by using two-way ANOVA followed by Tukey’s multiple comparisons test. (F) Effect of A-485 on changes in TGF-β-induced EMT marker expression, which was increased upon LIMD1-AS1 ectopic expression, in MCF10A-M2 cells. GAPDH, loading control. (G) Effect of A-485 on TGF-β-induced migration, which was increased upon LIMD1-AS1 ectopic expression, in MDA-MB-231 cells as analyzed by a transwell migration assay. The results are expressed as mean ± SD from four biological replicates. Significance was calculated using two-way ANOVA followed by Tukey’s multiple comparisons test. (H) Schematic of the working model. TGF-β-induced LIMD1-AS1 acts as a scaffold to promote p300–SMAD3 interaction and thereby enhances TGF-β target gene expression to reinforce TGF-β-induced cellular responses and to promote EMT, migration, and invasion in cancer cells. **0.001 < P < 0.01; ***0.0001 < P < 0.001; ****P < 0.0001.

References

    1. Pastushenko I, Blanpain C EMT transition states during tumor progression and metastasis. Trends Cell Biol. 2019; 29:212–26. 10.1016/j.tcb.2018.12.001. - DOI - PubMed
    1. Hanahan D Hallmarks of cancer: new dimensions. Cancer Discov. 2022; 12:31–46. 10.1158/2159-8290.CD-21-1059. - DOI - PubMed
    1. Bakir B, Chiarella AM, Pitarresi JR et al. EMT, MET, plasticity, and tumor metastasis. Trends Cell Biol. 2020; 30:764–76. 10.1016/j.tcb.2020.07.003. - DOI - PMC - PubMed
    1. Brabletz T, Kalluri R, Nieto MA et al. EMT in cancer. Nat Rev Cancer. 2018; 18:128–34. 10.1038/nrc.2017.118. - DOI - PubMed
    1. Yang J, Antin P, Berx G et al. Guidelines and definitions for research on epithelial-mesenchymal transition. Nat Rev Mol Cell Biol. 2020; 21:341–52. 10.1038/s41580-020-0237-9. - DOI - PMC - PubMed

MeSH terms