. 2025 Sep 1;16(1):8173.
doi: 10.1038/s41467-025-62908-2.

Temporal transcriptional regulation of mitochondrial morphology primes activity-dependent circuit connectivity

Affiliations

Temporal transcriptional regulation of mitochondrial morphology primes activity-dependent circuit connectivity

Iryna Mohylyak et al. Nat Commun. .

Abstract

Synaptic connectivity during development is known to require rapid local regulation of axonal organelles. Whether this fundamental and conserved aspect of neuronal cell biology is orchestrated by a dedicated developmental program is unknown. We hypothesized that developmental transcription factors regulate critical parameters of organelle structure and function which contribute to circuit wiring. We combined cell type-specific transcriptomics with a genetic screen to discover such factors. We identified Drosophila CG7101, which we rename mitochondrial integrity regulator of neuronal architecture (Mirana), as a temporal developmental regulator of neuronal mitochondrial quality control genes, including Pink1. Remarkably, a brief developmental downregulation of either Mirana or Pink1 suffices to cause long-lasting changes in mitochondrial morphology and abrogates neuronal connectivity which can be rescued by Pink1 expression. We show that Mirana has functional homology to the mammalian transcription factor TZAP whose loss leads to changes in mitochondrial function and reduced neurotransmitter release in hippocampal neurons. Our findings establish temporal developmental transcriptional regulation of mitochondrial morphology as a prerequisite for the priming and maintenance of activity-dependent synaptic connectivity.


Conflict of interest statement

Competing interests: The authors declare no competing interests.

Figures
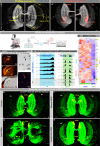
Fig. 1
Fig. 1. DCNs transcriptome analysis with subsequent RNAi screen of 74 upregulated genes.
A, A’ Multi Color Flip-Out (MCFO) staining of single DCN cell innervating Medulla (M-DCN) and Lobula (L-DCN). B Laser Micro Dissection of DCN clusters from brain cryosections of ato-Gal414A;UAS-CD8::GFP,UAS-RedStinger adult flies. 1, 1’- RedStinger fluorescent DCNs before (1, UV light) and after (1’, UV light, 1”, transmitted light) dissection. 2, 2’ - sample with dissected DCNs clusters in the transmitted (2) and UV (2’) light. Total RNA was extracted using Ambion RNAqueous Micro Kit and libraries were generated using SMART-seq2 Kit and Nextera Tagmentation Kit. NGS NextSeq 500 High Output Kit (400 million reads of apr. 25 million reads/sample coverage was used for sequencing). Created in BioRender. Hassan, B. (2025) https://BioRender.com/fma66dn. C Example of the marker gene atonal high-level expression in DCN samples compared to random central brain regions used as a control, with the equal expression of housekeeping genes. D Heatmap of top-20 genes expressed in DCNs. EH RNAi-screen of 74 DCN-enriched genes revealed 10 gene candidates causing significant phenotypical changes upon DCN-specific downregulation during development. Lo lobula, OC optic chiasm, Me medulla, DCNs Dorsal Cluster Neurons, VCNs Ventral Cluster Neurons. Scale bar – 20 µm. Genes expressed in DCNs and list of genes for the RNAi-screen are listed in Supplementary Fig. S1. Results of RNAi screen of 74 genes in Supplementary Fig. S1.
Fig. 2
Fig. 2. CG7101/Mirana downregulation causes significant reduction of DCN axons in medulla.
AG’ Temporal expression pattern of the tagged Mirana protein (67655BDSC combined with ato-Gal414A,UAS-CD4::tdTomato transgenes) during development DCNs shows highest peaks of protein detection at 30–40 h after puparium formation (P30-P40 APF) with subsequent decrease, scale bar – 5 µm. HL Constitutive downregulation of CG7101/Mirana using two independent RNAi lines (100127VDRC and 27849VDRC) and CRISPR/Cas9 approach (Mirana_sgRNA341305 and UAS-UM-Cas934007 from Heidelberg CFD CRISPR library) in DCNs (driven by ato-Gal414A) leads to a significant decrease in the number of DCNs axons in the medulla, detected at the late pupal stage (P72, HJ) and adult (KM). NR Temporal depletion of Mirana in DCNs using Mirana-RNAi100127;ato-Gal414A,UAS-CD4::tdTomato/tub-Gal80ts flies. N, O Mirana depletion in L3-P48 developmental window is sufficient to recapitulate loss of medulla innervation (R). Flies were kept at 18 °C until wondering L3 larvae, and then transferred for 48 h to 29 °C for heat shock inactivation of Gal80 repressor. After heat shock flies were transferred back to 18 °C and were kept there until 14 days old adults. In contrast, Mirana depletion in later developmental stages (from P48 until eclosion) did not cause loss of in medulla innervation (PR). Flies were kept at 18 °C until P48, and then transferred to 29 °C for heat shock inactivation of Gal80 repressor and kept there until eclosion. Adult flies were transferred into 18 °C and were kept there until 14 days old adults before dissection. OC optic chiasm, Me medulla, scale bar – 20 µm. We examined 12 P72 Control optic lobes, 29 P72 Mirana-RNAi100127, 126 optic lobes of control group adult flies (males and females), 83 of RNAi100127, 42 of RNAi27849, 14 of CRISPR/Cas9. In temporal depletion experiment in development: 34 optic lobes of control flies, 26 of Mirana-RNAi100127, in adult – 12 optic lobes of control flies and 12 of Mirana-RNAi100127. Statistical analysis was done using two-tailed Mann–Whitney test. Exact P values, *p < 0.05, **p ≤ 0.01, ***p ≤ 0.001, ****p ≤ 0.0001, ns not significant. Schematics created in BioRender. Hassan, B. (2025) https://BioRender.com/fma66dn.
Fig. 3
Fig. 3. Temporal Mirana depletion in Drosophila neurons leads to increase in mitochondrial size.
AG Mitochondria in M-DCNs axonal terminals labeled with mito-GFP in Control condition (Aw1118;UAS-mito::GFP/UAS-KK30B40D;ato-Gal414A,UAS-CD4::tdTomato) and constant Mirana downregulation using RNAi against Mirana (Bw1118;UAS-mito::GFP/UAS-Mirana100127;ato-Gal414A,UAS-CD4::tdTomato) and CRISPR/Cas9 system (Cw1118;UAS-mito::GFP/UAS-Mirana_gRNA;ato-Gal414A,UAS-CD4::tdTomato/UAS-UMCas9340007). Elongated mitochondria can be detected already in late pupal stages, and gradually increase in size until the adult stage (EG). HO Temporal Mirana downregulation during development (Mirana-RNAi100127/UAS-mito::GFP;ato-Gal414A,UAS-CD4::tdTomato/tub-Gal80ts vs UAS-KK30B40D/UAS-mito::GFP;ato-Gal414A,UAS-CD4::tdTomato/tub-Gal80ts) confirmed the developmental origin of the elongated mitochondria phenotype (HI, K) which is not observed in flies with adult specific depletion (J, K). For developmental depletion of Mirana, flies were kept at 29 °C until eclosion, and adults after hatching were transferred to 18 °C and kept there for 10–14 days before dissection. For reverse experiment of adult only depletion of Mirana (quantifications shown in K) flies of the same genotypes were kept at 18 °C until eclosion, and adults were immediately transferred to 29 °C, and kept there for 10–14 days before dissection. Within developmental stages, Mirana depletion specifically during L3-P48 resulted in elongated mitochondria in adult flies (L, M, O). In contrast, Mirana depletion at P48-adult (N, O) did not. Flies were kept at 18 °C until desired stage of depletion initiation, and then transferred for appropriate time (from L3 till P48, and from P48 till adult) to 29 °C for heat shock inactivation of Gal80 repressor. After heat shock flies were transferred back to 18 °C and were kept there until 14 days old adults before dissection. Mitochondrial size was manually measured through the Z-stack of a confocal image of one/two axons in the optic chiasm and medulla region in 4 different brains of each sex. Scale bar – 10 µm. Normal distribution was checked using the D’Agostino Pearson normality test before statistical comparisons. Nonparametric Kruskal–Wallis test with Dunn’s multiple comparison correction was used for mitochondria measurements in fly DCNs neurons. Adjusted p values. *p < 0.05, **p ≤ 0.01, ***p ≤ 0.001, ****p ≤ 0.0001, ns not significant. Schematics created in BioRender. Hassan, B. (2025) https://BioRender.com/fma66dn.
Fig. 4
Fig. 4. TZAP downregulation in mammalian COS7 cells and primary rat hippocampal neurons leads to defects in mitochondrial morphology and presynaptic neurotransmitter release.
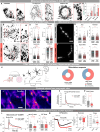
AA’ Mitochondrial morphology of TZAP downregulation (TZAP siRNA) and control (Control siRNA) in mammalian COS7 cells. We quantified the number of cells assigned into four main classes of dominant mitochondrial shapes: fissioned, filamentous, mixed, and donut-like. Downregulation of TZAP leads to a shift in the proportion of mitochondrial morphology towards filamentous and donut-like (A’, mean % shown on the graph). Representative images of cells with predominant donut-like mitochondria in control (B), and TZAP-RNAi (C). Scale bar – 10 µm. D Mitochondria morphology parameters (mean ± SEM shown on the graph), n = 1200 mitochondria for each condition. EG mitochondria morphology parameters in rat primary hippocampal neurons in control and TZAP-RNAi conditions. Scale bar 5 µm, n = 1397 control and 1218 TZAP_siRNA mitochondria. H Scheme of the rat primary neuron experiment created in BioRender. Hassan, B. (2025) https://BioRender.com/fma66dn. Primary neurons derived from rat hippocampus were cultured and sparsely co-transfected with vectors, carrying iGluSnFR and control_shRNA or TZAP_shRNA transgenes early at DIV 7 and then assayed upon maturation at DIV 21. I Percentage of responding and not-responding cells in both conditions. J Representative pseudo color images of glutamate release from presynaptic sites using iGluSnFR sensor in mature neurons (DIV 14-21). K Representative average presynaptic responses. K’ iGluSnFR fluorescence peaks (ΔF/F0) in both conditions, n = 13 control and 12 TZAP_shRNA neurons. Scale bar – 5 µm. L Representative mitochondria Ca2+ dynamics using GCaMP6f sensor. M ATP levels dynamics after stimulation. Data were obtained from 3 biological repeats. Normal distribution was checked using the D’Agostino Pearson normality test before statistical comparisons. A nonparametric two-tailed Mann–Whitney U test was used for mitochondria measurements in rat cortical neurons, two-tailed unpaired t-test to compare ATP recovery slope. COS7 cells data were analyzed by two-way ANOVA, with Tukey post hoc test for multiple comparisons (morphology classification), and unpaired two-tailed t-test (morphology parameters). Exact p values. P value - *p < 0.05, **p ≤ 0.01, ***p ≤ 0.001, ****p ≤ 0.0001, ns not significant.
Fig. 5
Fig. 5. Mirana downregulation reduces synaptic vesicle release and connectivity to postsynaptic cells.
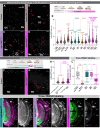
AB” Live imaging of steady state synaptic vesicle release using UAS-Syt1-mCherry::pHluorin pH sensitive fluorescence probe in control (AA”) and Mirana-RNAi100127 (BB”). C Ratio of green (pHluorin, cyan arrowheads) to red (mCherry) fluorescence and number of puncta in control (n = 6) and Mirana-RNAi condition (n = 7). DF’, I TransTango anterograde postsynaptic labeling of Mirana downregulation, with an expression of UAS-Mirana-RNAi100127 (n = 20 optic lobes) and Mirana_gRNA; UAS-UM-Cas9 (Supplementary Fig. S5, n = 25 optic lobes) compared to control (n = 17 optic lobes). Visible M-DCN axons in yellow arrowheads. Developmental Mirana depletion (from L1 till eclosion, FF’, I, n = 11 optic lobes). G, G’ Silencing of DCNs by overexpression of conductive form of potassium channel dORK (UAS-dORK1Δ-C(1), n = 18 optic lobes). H, H’ Nonconductive form of dORK (UAS-dORK1Δ-NC(1), n = 10 optic lobes) used as an additional control, showed no effect on TransTango labeling. DCNs expressing myrGFP on the cellular membrane are shown in green (D, D’, E, E’, F, G, H) and postsynaptic cells in magenta (merged picture) and grayscale (D, D”, E, E”, F, F’, G, G’, H, H’). Postsynaptic connectivity was analyzed by manually counting cell bodies in Medulla (white arrowheads) labeled with dsRed fluorescence (magenta, merged picture – DH and grayscale – D”, E”, F’, G’, H’), including all cells with weak or strong labeling to reveal all potential connections. Scale bar 20 µm. Object orientation behavior of flies with Mirana downregulation in DCNs in Buridan assay (J). K, L Individual fly trajectory during recording. K’, L’ Heat map of arena occupancy at the population level, n = 125 control and 135 RNAi100127 flies. M Absolute stripe deviation measurement, showing that Control flies (W+; UAS-KK40D30B;ato-Gal414A,UAS-CD4::GFP) normally walk more straight (represented in lover ASD value) than flies with Mirana downregulation (W+;UAS-Mirana-RNAi;ato-Gal414A,UAS-CD4::GFP). Me medulla, Lo lobula, OC optic chiasm. Ordinary one-way ANOVA with the Kruskal–Wallis test was used for the behavioral experiment and unpaired t-test with Welch’s correction for synaptic marker counting and trans-TANGO labeling analysis. Exact p values. *p < 0.05, **p ≤ 0.01, ***p ≤ 0.001, ****p ≤ 0.0001, ns not significant.
Fig. 6
Fig. 6. Mirana regulates the morphology of mitochondria in flies through expression tuning of downstream genes.
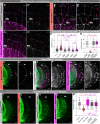
AE Mitochondria (labeled with mito-GFP) in DCNs axons under constitutive downregulation of Mirana target genes. FH Temporal pink1 downregulation during development (pink1-RNAi109614/UAS-mito::GFP;ato-Gal414A,UAS-CD4::tdTomato/tub-Gal80ts vs UAS-KK30B40D/UAS-mito::GFP;ato-Gal414A,UAS-CD4::tdTomato/tub-Gal80ts) during P48-adult time window (time point following Mirana peak expression) recapitulates the elongated mitochondria phenotype. For developmental depletion of pink1, flies were kept at 18 °C until P48, then transferred to 29 °C until eclosion, and adults after hatching were transferred to 18 °C, and kept there for 10–14 days before dissection. Mitochondria size was manually measured through the Z-stack of a confocal image of one/two axons in the Optic chiasm and Medulla region in at least 3/4 different brains of each sex. Scale bar – 10 µm. IL TransTango labeling of postsynaptic connectivity in Drp1 (Drp1-RNAi44155, n = 17 optic lobes), Atg1 (Atg1-RNAi16133, n = 20 optic lobes), and pink1 (pink1-RNAi109614, n = 18 optic lobes) downregulation in DCNs. L Number of postsynaptic cells was calculated by manually counting cell bodies in the medulla (white arrowheads) labeled with dsRed fluorescence (magenta and grayscale), including all cells with weak or strong labeling to reveal all potential connections. In case of pink1 downregulation, just like in Mirana silencing condition, we can find M-DCNs axons in Medulla (yellow arrowheads), however, TransTango labelling is severely decreased (K, K’, n = 18 optic lobes). Scale bar – 20 µm. Statistical analysis was done using the nonparametric Kruskal–Wallis test with Dunn correction for multiple comparisons and one-way ANOVA with Bonferroni correction for multiple comparisons respectively. Adjusted p values. *p < 0.05, **p ≤ 0.01, ***p ≤ 0.001, ****p ≤ 0.0001, ns not significant. Schematics created in BioRender. Hassan, B. (2025) https://BioRender.com/fma66dn.
Fig. 7
Fig. 7. Overexpression of pink1 in DCNs rescues all Mirana loss of function phenotypes.
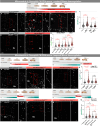
AC’ Mitochondria size (labeled with mito-GFP) in DCNs axons was rescued to that of controls (w1118;UAS-mito::GFP/UAS-KK40D30B,ato-Gal414A,UAS-CD4::tdTomato/UAS-pink1, AA’) with pink1 overexpression (w1118;UAS-mito::GFP/ UAS-Mirana-RNAi100127,ato-Gal414A,UAS-CD4::tdTomato/UAS-pink1, CC’). Mitochondria size was manually measured through the Z-stack of a confocal image of one/two axons in the optic chiasm and medulla in at least 3/4 different brains of each sex (D). Scale bar – 10 µm. HG’ Anterograde transsynaptic labeling of postsynaptic partner cells using the TransTango approach (E’, G’, n = 22 optic lobes for w1118;UAS-mito::GFP/UAS-KK40D30B,ato-Gal414A,UAS-CD4::tdTomato/UAS-pink1 and 20 optic lobes for w1118;UAS-mito::GFP/ UAS-Mirana-RNAi100127,ato-Gal414A,UAS-CD4::tdTomato/UAS-pink1). Postsynaptic connectivity was calculated by manually counting cell bodies in Medulla (white arrowheads) labeled with dsRed fluorescence (magenta and grayscale) (H, n = 17 optic lobes for Control-RNAi30B40D. N = 20 optic lobes for Mirana-RNAi100127. N = 22 optic lobes for Control-RNAi30B40D,UAS-pink1. N = 20 optic lobes for Mirana-RNAi100127,UAS-pink1), including all cells with weak or strong labeling to reveal all potential connections. Data are presented as mean values +/− SEM. Scale bar – 20 µm. IM Number of DCN axons reaching the Medulla in adult flies. pink1 overexpression (ato-Gal414A > UAS-Mirana-RNAi100127,UAS-pink1) restored the M-DCNs axons, caused by Mirana downregulation (M, n = 33 optic lobes for Control. N = 16 optic lobes for Mirana-CRISPR/Cas9, n = 21 optic lobes for pink1-RNAi n = 26 optic lobes for Control,UAS-pink1, n = 40 optic lobes for Mirana-RNAi100127,UAS-pink1. Measurements were done equally in flies of both sexes. Data are presented as mean values ± SEM. Me medulla. Scale bar − 20 μm. Statistical analysis was done using one-way ANOVA with Dunnett, and Bonferroni corrections for multiple comparisons in mitochondria length comparison. Adjusted p values. *p < 0.05, **p ≤ 0.01, ***p ≤ 0.001, ****p ≤ 0.0001, ns not significant.
Fig. 8
Fig. 8. Model of the temporal regulation of visual circuit development and the role of Mirana in the process.
mRNA of Mirana is detected at early pupal development, with peaking at P15–P30 APF, followed by Mirana protein peak expression levels at P30–P40 APF. This timepoint of temporal expression is a critical time window during which Mirana regulates expression of its target genes, including Pink1, and primes mitochondria health to ensure proper axon growth and circuit connectivity leading to appropriate visual responses. Created in BioRender. Hassan, B. (2025) https://BioRender.com/fma66dn.

References

    1. Misgeld, T. & Schwarz, T. L. Mitostasis in neurons: maintaining mitochondria in an extended cellular architecture. Neuron96, 651–666 (2017). - PMC - PubMed
    1. Kiral, F. R. et al. Autophagy-dependent filopodial kinetics restrict synaptic partner choice during Drosophila brain wiring. Nat. Commun.11, 1325 (2020). - PMC - PubMed
    1. Menon, S. & Gupton, S. L. Building blocks of functioning brain: cytoskeletal dynamics in neuronal development. Int. Rev. Cell Mol. Biol.322, 183–245 (2016). - PMC - PubMed
    1. Rangaraju, V. et al. Pleiotropic mitochondria: the influence of mitochondria on neuronal development and disease. J. Neurosci.39, 8200–8208 (2019). - PMC - PubMed
    1. Pekkurnaz, G. & Wang, X. Mitochondrial heterogeneity and homeostasis through the lens of a neuron. Nat. Metab.4, 802–812 (2022). - PMC - PubMed

MeSH terms

LinkOut - more resources