. 2025 Sep 1;16(1):8176.
doi: 10.1038/s41467-025-62789-5.

Coagulation factor XII haploinsufficiency is protective against venous thromboembolism in a population-scale multidimensional analysis

Affiliations

Coagulation factor XII haploinsufficiency is protective against venous thromboembolism in a population-scale multidimensional analysis

Amelia K Haj et al. Nat Commun. .

Abstract

Coagulation factor XII has been identified as a potential drug target that could prevent thrombosis without increasing the risk of bleeding. However, human data to support the development of factor XII-directed therapeutics are lacking. To assess the role of factor XII in venous thromboembolism, we examine genetic variation in the coding region of the F12 locus across 703,745 participants in the UK Biobank and NIH All of Us biorepositories. We find that heterozygous carriers of nonsense, frameshift, and essential splice site variants in F12 are protected against venous thromboembolism without an increased risk of bleeding or infection. We also show that F12 variant carriers generally experience a quantitative (type I) defect in circulating factor XII levels, though a subset of participants was also identified with possible qualitative (type II) deficiency. In vitro plasma-based thrombin generation is reduced at factor XII concentrations reflective of those seen in F12 variant carriers. We also show that F12 heterozygous mice are protected against venous thromboembolism and display an intermediate phenotype between wild-type and F12-null animals. We conclude that heterozygous loss of F12 represents a haploinsufficient state characterized by protection against venous thromboembolism and that therapeutically inhibiting factor XII is likely to be safe and effective.


Conflict of interest statement

Competing interests: The authors declare no competing interests.

Figures

Fig. 1
Fig. 1. Study design and characterization of coding variation in F12.
a Moderately rare (MAF ≤ 1%) variant filtering strategy, and b distribution and frequencies of high confidence loss-of-function (FIS = 1.0, MAF ≤ 1%) coding variants in the F12 locus identified in the UK Biobank (UKB) and NIH All of Us (AoU) datasets. There were 31 unique essential splice site variants that fell outside the exon boundaries and are not shown. Amino acids 1-19 (gray) comprise the FXII signal peptide. c Study breakdown by biobank and subpopulation as determined by principal components analysis of genetic ancestry. d For each moderately rare F12 variant, the in-cohort MAF was computed and plotted against the FIS value. All missense and HCLOF variants with in-cohort MAF ≤ 1% were included across the full range of FIS assignments.  Variants are shown stratified by the dataset in which they were found (“UKB” or “AoU”), with variants shared across both datasets noted (“Both”). e Variant counts for F12 are shown according to FIS threshold (black circles). For comparison, the in-group median variant allele count (MAF ≤ 1%) at each FIS threshold is shown for two gene sets: vitamin K (VK)-dependent coagulation factors (F2, F7, F9, F10) (orange squares) and the larger group of essential humoral coagulation factors (F2, F5, F7, F8, F9, F10) (red triangles). Variant counts for F12 and each gene set were normalized to the number of variants at the FIS = 0 threshold. Abbreviations: FIS functional impact score, FN2 fibronectin type 2 domain, EGF EGF-like domain, FN1 fibronectin type 1 domain, KD kringle domain, PRR proline rich region, AFR African, AMR admixed American, EAS East Asian, EUR European, SAS South Asian, MID Middle Eastern, MAF minor allele frequency, VK vitamin K-dependent.
Fig. 2
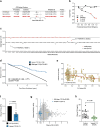
Fig. 2. Association of F12 variant carrier status with venous thromboembolism (VTE) in the UK Biobank and NIH All of Us cohorts (N = 703,745).
a Cox proportional hazards regression with Firth’s penalized likelihood modeling was performed in the UK Biobank (UKB) and NIH All of Us (AoU) datasets, followed by random-effects model meta-analysis. All models were adjusted for sex, the first 10 principal components of genetic ancestry, and additional covariates as depicted in Table S3. (**) = value of ≤20 redacted to comply with NIH reporting regulations. b Cox proportional hazards regression for VTE followed by trans-cohort meta-analysis was repeated across a range of FIS thresholds with adjustment performed as in (a). Effect size estimates are nominally significant for the points displayed in red (P ≤ 0.024; significance threshold not adjusted for multiple comparisons). c A leave-one-variant-out (LOVO) analysis was performed using iterative Firth’s logistic regression modeling across all FIS = 1.0 variants in both cohorts. Outliers identified by the two-sided extreme studentized deviate (Grubbs) test are labeled. d Integrated Kaplan–Meier survival analysis across both UKB and AoU (N = 753,617) comparing incident VTE occurring after study enrollment between F12 variant carriers (blue) and non-carriers (black). Historical (prevalent) VTE events occurring prior to study enrollment were excluded. e For all F12 variant carriers (MAF ≤ 1%) in the UKB Pharma Proteomics Project (PPP) dataset with available plasma proteomics data (N = 626), we plotted variant FIS against the plasma FXII concentration in linearized NPX (L-NPX) units as determined by Olink®. The P-value for trend derived from the F-test is shown. f Mean (±SEM) circulating FXII levels as determined by Olink® (L-NPX) were compared between wild-type individuals (N = 41,041) and carriers of nonsense, frameshift, and insertion/deletion variants in F12 (FIS = 1.0) by unpaired two-sided t-test (N = 11). g Scatter plot showing the distribution of plasma FXII levels vs. the concentrations of GAPDH, a standard plasma housekeeping protein (N = 42,100). Vertical dotted lines represent the median plasma FXII value in L-NPX units for F12 variant carriers at FIS = 1.0 (blue) and the median plasma FXII concentration for the entire population (black). h Plasma samples from F12 variant carriers (FIS = 1.0, N = 29) and age- and sex-matched wild-type controls (N = 29) in the MGB Biobank were assayed for FXII concentration by enzyme-linked immunosorbent assay (ELISA) and compared by unpaired two-sided t-test. Carriers of essential splice site (ESS) variants were excluded from the analyses in (eh).
Fig. 3
Fig. 3. Associations between F12 variant carrier status and adverse events.
a Cox proportional hazards regression modeling followed by trans-cohort meta-analysis was performed to examine the associations between F12 variant carrier status (FIS = 1.0) and the occurrence of VTE, bleeding, and sepsis (blue) in the UKB and AoU datasets (N = 703,745). Using the same approach, separate effect size estimates (±95% CI) for each phenotype were generated using only synonymous variants in F12 (orange). Models were adjusted for sex and ancestry as well as the additional covariates listed in Tables S7 and S8. b, c In assessments restricted to UKB dataset (N = 414,670), we used Kaplan–Meier analysis to compare overall mortality between F12 variant carriers and non-carriers, followed by two-sample comparisons of markers of fertility. Two-sided t-test P values are shown; whiskers show 5th–95th percentile range, and individual values falling above the 95th percentile are not shown. (Live births: WT N = 244,079, variant N = 989, 424 outliers not shown; still births: WT N = 77,899, variant N = 449, 855 outliers not shown; children fathered: WT N = 204,370, variant N = 767, 796 outliers not shown). d Using serial Firth’s logistic regression analyses adjusting for age, sex, and ancestry, we evaluated the associations between 138 discrete infection phenotypes and F12 variant carrier status. The “any infection” category denotes positive status for any of the 138 phenotypes. Upward triangles represent directionally positive associations, whereas downward triangles represent directionally negative associations. The dashed line represents the Bonferroni-corrected statistical significance threshold, P < 3.6 × 10−4.
Fig. 4
Fig. 4. Influence of FXII concentration on plasma-based thrombin generation.
Representative thrombin generation curves for FXII-deficient plasma reconstituted with varying levels of FXII zymogen in a silica-initiated and b tissue factor (TF)-initiated assays. Quantitative summary data from calibrated automated thrombography assays are shown, including c thrombin generation velocity, d peak thrombin generation, and e endogenous thrombin potential (ETP) (n = 3 independent experiments, data presented as mean ± SD). Conditions marked by an asterisk (*) differ significantly (P < 0.05, by two-sided t test) from the condition with 100% FXII zymogen levels. f Activated partial thromboplastin time (aPTT) and prothrombin time (PT) assays performed on FXII-deficient plasma reconstituted with varying concentrations of FXII zymogen. Abbreviations: aPTT activated thromboplastin time, PT prothrombin time.
Fig. 5
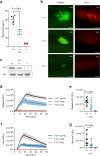
Fig. 5. Effect of F12 heterozygosity on venous thrombus formation in mice.
Plasma levels of FXII antigen were determined in F12+/+ (N = 6), F12+/− (N = 6), and F12−/− (N = 7) mice by a ELISA (median ± IQR, P value computed using one-way ANOVA) and b western blotting. c Venous thrombus formation was evaluated in F12+/+, F12+/− and F12−/− mice using the femoral vein electrolytic injury model with representative images of platelet accumulation (green) and fibrin formation (red) after vascular injury. Scale bar = 200 µm. d Quantification of platelet fluorescence intensity (in relative fluorescence units, RFU; data presented as mean ± SEM) over time and e the integrated platelet fluorescence intensity expressed as area under the curve (AUC ± SD) values, according to F12 genotype (F12+/+, N = 10; F12+/−, N = 10; F12−/−, N = 8; P value computed using one-way ANOVA). Similarly, fibrin fluorescence intensity over time (f) and the integrated fibrin fluorescence intensity (g) were quantified by genotype. Abbreviations: RFU relative fluorescence units, AUC area under curve.

References

    1. Ortel, T. L. et al. American Society of Hematology 2020 guidelines for management of venous thromboembolism: treatment of deep vein thrombosis and pulmonary embolism. Blood Adv.4, 4693–4738 (2020). - PMC - PubMed
    1. Agnelli, G. et al. Apixaban for the treatment of venous thromboembolism associated with cancer. N. Engl. J. Med.382, 1599–1607 (2020). - PubMed
    1. Granger, C. B. et al. Apixaban versus warfarin in patients with atrial fibrillation. N. Engl. J. Med.365, 981–992 (2011). - PubMed
    1. Connolly, S. J. et al. Apixaban in patients with atrial fibrillation. N. Engl. J. Med.364, 806–817 (2011). - PubMed
    1. Investigators, E.-P. et al. Oral rivaroxaban for the treatment of symptomatic pulmonary embolism. N. Engl. J. Med.366, 1287–1297 (2012). - PubMed

LinkOut - more resources