. 2025 Sep 1;16(1):8151.
doi: 10.1038/s41467-025-62878-5.

Mature and migratory dendritic cells promote immune infiltration and response to anti-PD-1 checkpoint blockade in metastatic melanoma

Affiliations

Mature and migratory dendritic cells promote immune infiltration and response to anti-PD-1 checkpoint blockade in metastatic melanoma

Jiekun Yang et al. Nat Commun. .

Abstract

Immune checkpoint inhibitors (ICIs) have revolutionized cancer therapy, yet most patients fail to achieve durable responses. To better understand the tumor microenvironment (TME), we analyze single-cell RNA-seq (~189 K cells) from 36 metastatic melanoma samples, defining 14 cell types, 55 subtypes, and 15 transcriptional hallmarks of malignant cells. Correlations between cell subtype proportions reveal six distinct clusters, with a mature dendritic cell subtype enriched in immunoregulatory molecules (mregDC) linked to naive T and B cells. Importantly, mregDC abundance predicts progression-free survival (PFS) with ICIs and other therapies, especially when combined with the TCF7 + /- CD8 T cell ratio. Analysis of an independent cohort (n = 318) validates mregDC as a predictive biomarker for anti-CTLA-4 plus anti-PD-1 therapies. Further characterization of mregDCs versus conventional dendritic cells (cDC1/cDC2) highlights their unique transcriptional, epigenetic (single-nucleus ATAC-seq data for cDCs from 14 matched samples), and interaction profiles, offering new insights for improving immunotherapy response and guiding future combination treatments.


Conflict of interest statement

Competing interests: The authors declare that they have no conflict of interest.

Figures

Fig. 1
Fig. 1. Characterization of cells in human metastatic melanoma tumors.
A Demographic summary of 36 samples included in this study. Pfs, progression-free survival; os, overall survival; NR, non-responder; R, responder. B Uniform manifold approximation and projection (UMAP) embedding of 189,362 cells from 36 samples, after quality control, with each color representing a cell type. C Dotplot showing average normalized expression and percent normalized expression of marker genes across cell types.
Fig. 2
Fig. 2. Cell subtypes and their relative proportion correlations in the tumor microenvironment.
AC UMAP embedding of myeloid cell subtypes of 14,487 cells from 36 samples (A), CD8 T-cell subtypes of 20,078 cells from 33 samples (B), and CD4 T-cell subtypes of 17,715 cells from 32 samples (C). D Heatmap illustrating correlation coefficients among the relative proportions of cell subtypes in relation to their corresponding cell types across 35 samples. We identified clusters/modules by segmenting the hierarchical clustering tree at the red line. Source data are provided as a Source Data file.
Fig. 3
Fig. 3. Mature and regulatory cDCs associated with ICI response and patient survival.
A Boxplots comparing relative proportions of four subtypes between ICI non-responders (n = 13) and responders (n = 5). Each dot represents a sample, with its color corresponding to the type of ICI and its shape corresponding to the melanoma subtype. One sample lacking detectable tumor cells, monocytes/macrophages and cDCs was excluded from this analysis and the following analysis. B Survival plots for 18 samples only treated with ICI and split by 20% of mregDC relative proportion, which roughly contained 25% of all the samples. C Survival plots for 33 samples and split by both mregDC relative proportion and TCF7 + CD8 T ratio. Three samples lacked CD8 + T cells and were excluded from this analysis. D Boxplot comparing mregDC signature scores, calculated using ssGSEA, between non-responders and responders in 318 ICI-treated bulk RNA-seq samples. E Boxplot comparing mregDC signature scores, calculated using ssGSEA, between non-responders and responders split by four treatment types for 318 samples. F Progression-free survival plot for the 318 bulk RNA-seq samples split by their mregDC scores. P-values for boxplots in all panels were calculated using the two-sided Wilcoxon rank sum test. P-values for survival plots in all panels were calculated using the Log-rank sum test. NR, non-responder; R, responder; combo, anti-PD-1+anti-CTLA-4; PFS, progression-free survival; OS, overall survival. The boxplots in panels A, D and E show the distribution of the data, with the central line representing the median (50th percentile), the box indicating the interquartile range (IQR) from the 25th to 75th percentile, and the whiskers extending to the minimum and maximum values within 1.5 times the IQR. Outliers beyond this range are plotted as individual points. Source data are provided as a Source Data file.
Fig. 4
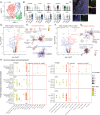
Fig. 4. Transcriptional landscape and interactome of cDC subtypes.
A UMAP embedding of 2,068 cDCs from 35 samples colored by the subtypes. B Violin plots of canonical marker genes for cDC1, cDC2 and mregDC. C Multiplex immunofluorescence overlay of a human sentinel lymph node tissue (number of markers = 4). Representative images of mregDC marker CCR7 (pseudocolored magenta), dendritic cell marker CD11c (pseudocolored green), IRF8 and IRF4 marker (pseudocolored yellow and red, respectively) are shown on the right. CD11c + CCR7+ cells expressing either both IRF4+ and IRF8+ markers (red arrow) or IRF8+ alone (yellow arrow) cells are indicated on each of the panel figures. Nuclei were counterstained with Hoechst 33342. The immunofluorescence results are representative of two independent tissue samples. Scale bar = 8 µm. D, F Volcano plots showing differentially expressed genes (DEGs) between 338 mregDCs and 513 cDC1s (D) and between 338 mregDCs and 1217 cDC2s (F) by using cDCs from 35 samples. An adjusted P-value of 0.001 was used to call significant DEGs. Examples of genes with mregDC-specific enhancers were colored in green, which were mentioned in Fig. 5. E, G Networks of enriched terms for DEGs up- or down-regulated in mregDC compared to cDC1 (E) or cDC2 (G). H Dotplots illustrating inferred cell-cell communications by CellPhoneDB, either with differential activities between mregDC and other cDC or exclusively detected in mregDC. The left and right panels plotted interactions with cDC expressing ligands and CD8 or CD4 T-cell expressing receptors, respectively. P-values for volcano plots and dotplots were calculated using the two-sided Wilcoxon rank sum test. The hypergeometric test was used for panels E and G without multiple comparison adjustments.
Fig. 5
Fig. 5. Epigenomic landscape of cDC subtypes using snATAC-seq data.
A Co-embedding of 2,302 cDCs from 35 samples with scRNA-seq data and 14 samples with snATAC-seq data, with colors corresponding to assays (left) or subtypes (right). B Differentially accessible regions between 14 mregDCs and 17 cDC1s (top), and 14 mregDCs and 203 cDC2s (bottom). The p-value cutoff is 0.01. C Motifs enriched in differentially accessible regions between 14 mregDCs and 17 cDC1s (left), and 14 mregDCs and 203 cDC2s (right). Significantly enriched motifs were marked with an asterisk (adjusted p-value < = 0.05). D Track plots comparing normalized number of reads across cDC subtypes (17 cDC1s, 203 cDC2s and 14 mregDCs) underlying enhancers associated with genes important for cDC functions. mDC is short for mregDC in some figure panels due to space constraints. A peak is colored orange if it contains motifs for members of the NF-κB transcription factor family. The same data object was used for all panels. The two-sided Wilcoxon rank sum test was performed in panel B without multiple comparison adjustments. The hypergeometric test was used for panel C without multiple comparison adjustments.
Fig. 6
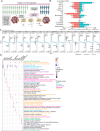
Fig. 6. Cell type-specific molecular factors associated with mregDC proportions.
A Illustration of sample splitting, model used, and downstream analyses performed to identify cell type-specific molecules associated with mregDC proportion. This analysis included 25 mregDC low samples and 10 mregDC high samples. Created in BioRender. Yang, J. (2025) https://BioRender.com/fdiieqb. B Bar plots showing the number of cell type-specific differentially expressed genes (DEGs) significantly upregulated or downregulated in 10 mregDC high samples compared to 25 mregDC low samples, detected by a linear mixed model. C Aggregated rank-logFC plots across cell types showing DEGs passing the adjusted P-value threshold 0.05 in light blue and the rest of the genes in gray. The top two genes with large average log2 fold changes in both directions are labeled. D Dot plots illustrating the top three pathways enriched by the up and downregulated DEGs for each cell type. The pathway names were colored by biological themes. The same 35 samples were used for all panels. For panel C, negative binomial mixed models were fit to the data, with two-sided t values used to determine statistical significance. Multiple comparison adjustments were carried out for the obtained p-values. Please see the Methods section for more details.

References

    1. Liu, W. et al. Dissecting the tumor microenvironment in response to immune checkpoint inhibitors via single-cell and spatial transcriptomics. Clin. Exp. Metastasis 41, 313–332 (2023). - PMC - PubMed
    1. Knight, A., Karapetyan, L. & Kirkwood, J. M. Immunotherapy in melanoma: recent advances and future directions. Cancers15, 1106 (2023). - PMC - PubMed
    1. Larkin, J. et al. Five-year survival with combined nivolumab and ipilimumab in advanced melanoma. N. Engl. J. Med.381, 1535–1546 (2019). - PubMed
    1. Rohaan, M. W. et al. Tumor-infiltrating lymphocyte therapy or ipilimumab in advanced melanoma. N. Engl. J. Med.387, 2113–2125 (2022). - PubMed
    1. Van Allen, E. M. et al. Genomic correlates of response to CTLA-4 blockade in metastatic melanoma. Science350, 207–211 (2015). - PMC - PubMed

MeSH terms

Substances