. 2025 Sep 1;11(1):102.
doi: 10.1038/s41540-025-00585-z.

Leveraging quantitative systems pharmacology modeling for elranatamab regimen optimization in relapsed or refractory multiple myeloma

Affiliations

Leveraging quantitative systems pharmacology modeling for elranatamab regimen optimization in relapsed or refractory multiple myeloma

Kamrine E Poels et al. NPJ Syst Biol Appl. .

Abstract

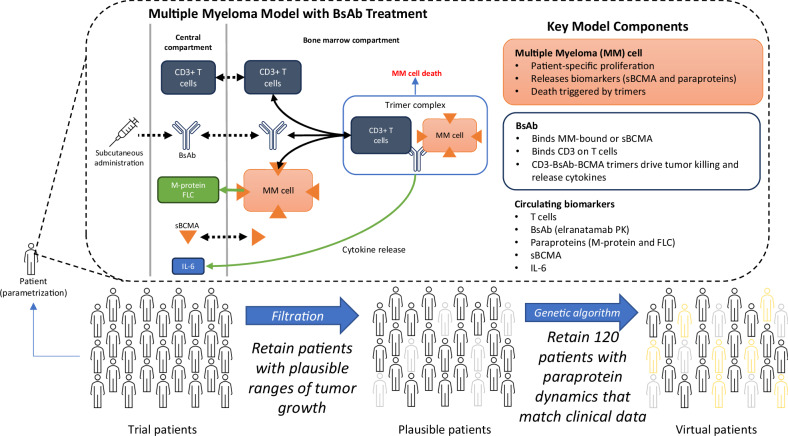
Elranatamab, an approved bispecific antibody (BsAb) for relapsed/refractory multiple myeloma, forms an immune synapse between the T-cell CD3 marker and B-cell maturation antigen (BCMA) on myeloma cells. Circulating soluble BCMA (sBCMA) is associated with disease burden and may reduce drug exposure, impacting efficacy. A quantitative systems pharmacology model that captures elranatamab's mechanism of action and disease dynamics was developed and calibrated to clinical datasets. Simulations explored model uncertainty and inter-patient variability with respect to biological, pharmacologic, and tumor-related components to inform clinical dose-response relationships and evaluate the effect of baseline sBCMA levels on dose and regimen. Model simulations supported 76 mg weekly as the optimal regimen, including in patients with high sBCMA. A left shift in the dose-response curve among virtual responders supported maintenance of efficacy with less frequent dosing. This work exemplifies how mechanistic models may support BsAb dose and regimen justification within the framework of model-informed drug development.


Conflict of interest statement

Competing interests: All authors were employees of Pfizer when the work took place.

Figures

Fig. 1
Fig. 1. Schema of QSP and virtual population simulation framework.
The QSP model describes the dynamic changes in MM cells over time in the BM, which provides a generalized site-of-action compartment. A BsAb engages CD3 receptors on T cells and BCMA receptors on MM cells to form BsAb-CD3-BCMA dimers and trimers. Trimers can facilitate MM cell death, activate T cells, and lead to pro-inflammatory cytokine production that helps attenuate T-cell migration out of the BM compartment. MM cells produce paraproteins such as M-protein and FLC that can be used for assessment of responses in virtual patients. MM cells can shed sBCMA both in the BM and in circulation. A BsAb can bind to sBCMA, as well as T cells in circulation in the central compartment (binding not visualized in the schematic). Model parameters and initial states are varied when the model is initiated, and a trial patient is defined as a non-informed parametrization of the model. From trial patients, we select a population of plausible patients with tumor doubling times that fall within a range supported by the literature. We then select 120 virtual patients from the plausible patient pool such that their summary efficacy endpoints and paraprotein dynamics match those of the elranatamab trial patients. We repeat this step 10 times, selecting different sets of 120 virtual patients. BM bone marrow, BsAb bispecific antibody, FLC free light chain, MM multiple myeloma, PK pharmacokinetics, QSP quantitative systems pharmacology, sBCMA soluble B-cell maturation antigen.
Fig. 2
Fig. 2. Calibration of model virtual populations to clinical data.
a Due to its potential role as a drug-sink, sBCMA was identified as a baseline predictor of response. Stratification of patients by baseline sBCMA levels showed a distinction of dose-response curves in the MM-1 study. b Efficacy biomarkers and sBCMA are states in the model initialized by sampling patient-specific initial values. The distribution of each variable is fitted to clinical data and used to initiate the plausible patients. After the model is fitted, the density of virtual patients does not show extensive deviation from the distribution of the observed patients (data). c Percent change from baseline of paraprotein was used for model calibration across all studies. Median change from baseline and 95% prediction intervals of a VPop are shown in the red solid line and shaded area, respectively, compared to the observed median and 95% coverage of observed values shown in black dots and error bars, respectively. d Best biochemical response (i.e., BOR) was also used for model calibration in larger studies. Simulated best response of 120 virtual patients is shown in colored bars, compared with the best biochemical response of 120 patients in MM-3 Cohort A shown in dots colored by baseline sBCMA level. Responses are ranked in ascending order in terms of efficacy. FLC free light chain, MM MagnetisMM, sBCMA soluble B-cell maturation antigen, VPop virtual population.
Fig. 3
Fig. 3. Simulated BRR of ten VPops across increasing dose schedules.
Explored doses ranged from 16 mg to 152 mg QW. A 76 mg Q2W regimen was also simulated and resulted in very similar efficacy as measured by the BRR of 44 mg QW. Error bars represent 95% confidence intervals. a BRR stratified by baseline sBCMA levels. The model suggests that the optimal regimen for patients with low sBCMA levels (blue) and high sBCMA levels (red) is 76 mg Q2W (BRR, 81%) and 152 mg QW (BRR, 53%), respectively. b For all virtual patients, simulated BRR ranged from 39% to 68%, and there was no significant gain in efficacy from 76 mg QW (68%) to 152 mg QW (66%). BRR biochemical response rate, QW once weekly, Q2W every 2 weeks, sBCMA soluble B-cell maturation antigen, VPop virtual population.
Fig. 4
Fig. 4. Optimal dose for tumor-killing activity depends on patient-specific and time-dependent factors.
a The proportion of trimers, or a trimer:BCMA ratio, is plotted against the average BsAb concentration for 4 VPs, with each dose colored by response (red dot: no response, blue dot: biochemical response). A higher proportion of trimer suggests more antitumor activity based on the bell-shaped dose-response theory for BsAbs. VPs 9, 13, and 14 were objective biochemical responders and showed a peak of antitumor activity for lower doses, and a bell-shaped curve is evident for VPs 9 and 14. For these 3 patients, a higher BsAb concentration, a consequence from either a higher dose or lack of dose reduction, could result in inferior efficacy. VP 22, which was a nonresponder at all doses, has a monotonically increasing response curve, suggesting that an optimal dose was not seen within the range of doses simulated. All shown patients have a BL sBCMA < 100 ng/mL for simplicity. b sBCMA and c T cells in bone marrow were the most significant predictors for dose response curve shape, suggesting that patients with higher counts of these variables would benefit of higher dosing or drug exposure to improve antitumor efficacy. BsAb, bispecific antibody; QW, once weekly; sBCMA, soluble B-cell maturation antigen; VP, virtual patient.
Fig. 5
Fig. 5. Evaluation of maintenance of efficacy for different dose-reduction regimens.
Across the 10 fitted VPops, there were a total of 779 virtual patients that responded to the 76 mg QW regimen with a two–step-up priming. After confirmed biochemical response, we simulated 3 scenarios: (1) switching from QW to Q2W dosing after week 24 of therapy, (2) further switching from Q2W to Q4W starting at cycle 13 (C13), and (3) maintaining QW dosing. a A comparison between these regimens showed that 664 of 779 (85.2%) virtual patients saw greater tumor shrinkage with Q2W vs QW dosing following a confirmed response by C13. Starting at C13, when the Q2W to Q4W switch started, among the remaining responders, 87.9% had more tumor shrinkage under the Q4W vs Q2W regimen until the end of therapy. b Among the 779 total responders from the 10 VPops, an average of 17.4% of patients progressed after switching to Q2W starting at C7, the same number of patients progressed in the scenario with two dose reductions (Q4W after C12), and 22.8% of responders progressed when they continued with the QW regimen (error bars represent 95% CIs). c Average trimer:tumor cell ratio in virtual patients receiving a regimen of QW to Q2W switch vs QW to Q2W to Q4W vs no switch after C18 and d C36. On average, there was a statistically significant higher trimer:tumor cell ratio in the regimens with dose reductions, suggesting greater antitumor activity following a dose reduction. All pairwise comparisons were performed using Wilcoxon two-sided paired tests. C cycle, QW once weekly, Q2W every 2 weeks, Q4W every 4 weeks, VPop virtual population.
Fig. 6
Fig. 6. Stricter response criteria for QW to Q2W transition may decrease maintenance of response in few patients.
a Biochemical response, defined as confirmed PR or better, is equal between both regimens, with 77% and 37% of virtual patients with low and high sBCMA levels at baseline, respectively, reaching a biochemical response. Error bars represent 95% CIs. Among these responders, b the predicted PD percentage of the scenarios of switching from QW to Q2W for PR or better vs VGPR or better response suggest that PR or better response for switching can be beneficial. c Box plots of trimer:tumor cell ratio across virtual patients are not significantly different between the two scenarios. d Simulation of median levels of paraproteins under a regimen of 76 mg Q2W is shown in solid curves with 95% CIs, and data from 13 patients with RRMM are shown in dots, colored by biochemical response. PD progressive disease, QW once weekly, Q2W every 2 weeks, RRMM relapsed or responsive multiple myeloma, sBCMA soluble B-cell maturation antigen, VGPR very good partial response.

References

    1. Furukawa, Y. & Kikuchi, J. Molecular basis of clonal evolution in multiple myeloma. Int. J. Hematol.111, 496–511 (2020). - PubMed
    1. Kumar, S. K. et al. Multiple myeloma. Nat. Rev. Dis. Prim.3, 17046 (2017). - PubMed
    1. Rajkumar, S. V. Multiple myeloma: 2022 update on diagnosis, risk stratification, and management. Am. J. Hematol.97, 1086–1107 (2022). - PMC - PubMed
    1. Borrello, I. Can we change the disease biology of multiple myeloma?. Leuk. Res36, S3–S12 (2012). - PMC - PubMed
    1. Moreau, P. et al. Newly diagnosed myeloma in 2020. American Society of Clinical Oncology Educational Book, p. e144-e158 (2020). - PubMed

MeSH terms

Substances