. 2025 Sep 1;16(1):8171.
doi: 10.1038/s41467-025-63659-w.

AEBP1 drives fibroblast-mediated T cell dysfunction in tumors

Affiliations

AEBP1 drives fibroblast-mediated T cell dysfunction in tumors

Xiaoyu Wang et al. Nat Commun. .

Abstract

T cell dysfunction enables tumor immune evasion, understanding its mechanism is crucial for improving immunotherapy. Here we show, by RNA-sequencing analysis of human colon adenocarcinoma and triple-negative breast cancer tissues, that expression of Adipocyte Enhancer-Binding Protein 1 (AEBP1) positively correlates with T cell dysfunction and indicative of unfavorable patient outcomes. Subsequent single-cell RNA sequencing identifies cancer-associated fibroblasts (CAF) as the primary AEBP1 source. Fibroblast-specific AEBP1 deletion in mice enhances T cell cytotoxicity and suppresses tumor growth. Mechanistically, autocrine AEBP1 binds CKAP4 on CAFs, activating AKT/PD-L1 signaling to drive T cell dysfunction. By molecular-docking-based virtual screening we identify Chem-0199, a drug that disrupts the interaction between AEBP1 and CKAP4, thereby enhancing antitumor immunity. Both genetic and pharmacological AEBP1 inhibition synergize with immune checkpoint blockade in syngeneic models. Our study establishes AEBP1 as a key regulator of CAF-mediated T cell dysfunction and a therapeutic target.


Conflict of interest statement

Competing interests: The authors declare no competing interests.

Figures

Fig. 1
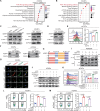
Fig. 1. CAF-derived AEBP1 is associated with T cell dysfunction and closely related to poor survival.
A Illustration of the workflow, including the cohorts of tumor samples and an overview of analytical approaches used. Created in BioRender. Xiaoyu, W. (2025) https://BioRender.com/5uvgprp. B T cell dysfunction scores of indicated genes in pan-cancer based on TIDE system. C Expression levels of AEBP1 in the cell clusters in TME based on scRNA-seq data from COAD (CRC_GSE146771_Smartseq2). D Expression levels of AEBP1 in the cell clusters in TME based on scRNA-seq data from TNBC (BRCA_GSE114727_inDrop). IF staining showed representative images of AEBP1 (green) and α-SMA (red) in human COAD (E) or TNBC (F) tissues. Scale bar, 50 μm. n = 3 biological replicates. Correlation between GZMB and AEBP1 expression in human COAD (G) or TNBC (H) samples was detected by IHC (two-sided Spearman correlation analysis). I, J Overall survival of COAD or TNBC patients with AEBP1high or AEBP1low expression levels in an in-house cohort. Source data are provided as a Source Data file.
Fig. 2
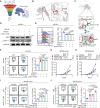
Fig. 2. Blocking Aebp1 in fibroblasts enhances T cell antitumor immunity.
MC38 (A) and EO771 (B) tumor growth from WT versus Aebp1 cKO mice (p < 0.0001). Percentage of IFN-γ+ and TNF-α+ CD8+ T cells in MC38 (C) and EO771 (D) tumors from WT versus Aebp1 cKO mice. Percentage of CD8+ T cells in MC38 (E) and EO771 (F) tumors from WT versus Aebp1 cKO mice, p < 0.0001 (F). Representative images (G) and correlation between AEBP1+α-SMA+ cells and CD8+ or GZMB+CD8+ T cells expression in human TNBC tissues (two-sided Spearman correlation analysis) (H). I MC38 tumor growth with CD8+ T cells depleted by anti-CD8 antibodies. J tSNE plot of tumor infiltrating lymphocytes (TILs) overlaid with the expression of indicated markers from WT or Aebp1 cKO group. K Frequency of clusters of indicated immune cell subsets in MC38 tumors from WT and Aebp1 cKO group, p < 0.0001 for WT vs. cKO in cluster 1. n = 5 mice/group (AF, I, K). Data are presented as the mean ± SEM (AF, I, K). Data were analyzed by two-sided unpaired Student’s t-test (CF, K), and two-way ANOVA with Sidak’s (A, B) or Tukey’s (I) multiple comparisons test. Source data are provided as a Source Data file.
Fig. 3
Fig. 3. scRNA-seq uncovers that CAF-derived Aebp1 reshapes the tumor immune microenvironment.
A Expression level of Aebp1 in the indicated cell clusters of EO771 tumors based on scRNA-seq. B Percentage of immune cell clusters in the EO771 tumors from WT or Aebp1 cKO group. C Percentage of fibroblast subtypes in the EO771 tumors from WT or Aebp1 cKO group. D Trajectory analysis of fibroblast subtypes. Cell types were color-coded and arranged by pseudo-time (left). Blue colors were based on pseudo-time (middle). Change of Aebp1 expression in the cell types based on pseudotime (right). E The expression of Aebp1 in indicated fibroblast subtypes based on pseudotime. F Percentage of indicated T cell clusters in the EO771 tumors from WT or Aebp1 cKO group. G Expression levels of Ifng and Gzmb in the Teff cell clusters of EO771 tumors based on scRNA-seq analysis (n = 79 for WT, n = 191 for cKO, two-sided unpaired Student’s t-test).
Fig. 4
Fig. 4. Blocking AEBP1 down-regulates PD-L1 expression on CAFs.
A Gene ontology analysis by RNA sequencing of shNC or shAebp1 mouse CAFs (mCAFs) (n = 3 mice/group). Heatmap shows the differentially expressed genes (DEGs) and associated signatures. B scRNA-seq analysis showing the expression of DEGs including Cd274 in fibroblasts in EO771 tumors from WT (n = 184) or Aebp1 cKO (n = 445) group. C The expression of PD-L1 in AEBP1high or AEBP1low human COAD samples was detected by IHC (two-sided Spearman correlation analysis). Flow cytometry analysis of PD-L1 expression on CAFs in WT or Aebp1 cKO tumors of MC38 (D) and EO771 (E) models (n = 5 mice/group). Flow cytometry analysis of PD-L1 expression on shNC and shAEBP1 hCAFs (F), or WT and Aebp1-/- mCAFs (G). Flow cytometry analysis of PD-L1 expression on hCAFs or mCAFs treated with IgG or rhAEBP1 (2 μg/ml) (H)/rmAEBP1 (1 μg/ml) (I). J Percentages of IFN-γ+ or TNF-α+ CD8+ T cells co-cultured with shNC or shAEBP1 hCAFs pre-treated with IgG, or anti-PD-L1 antibodies (10 μg/mL). n = 3 biological replicates (FJ). Data are presented as the mean ± SEM (DJ). Data were analyzed by two-sided unpaired Student’s t-test (B, D, E, GI), and one-way ANOVA with Dunnett’s (F) or Tukey’s (J) multiple comparisons test. p < 0.0001 (E, F). Source data are provided as a Source Data file.
Fig. 5
Fig. 5. Ckap4 is a receptor for AEBP1 activities in CAFs.
A KEGG analysis of scRNA-seq data showing the enriched signaling pathways in CAFs from WT tumors, in comparison to those from Aebp1 cKO tumors. B KEGG analysis of RNA-seq data showing the enriched signaling pathways in shNC CAFs compared with shAebp1 CAFs. Hypergeometric test (one-sided) with BH-FDR (A, B). C Western blot analysis of total AKT and p-AKT expression in shNC and shAEBP1 hCAFs, or WT and Aebp1-/- mCAFs. GAPDH was used as a loading control. D Western blot analysis of total AKT and p-AKT expression in hCAFs treated with IgG or rhAEBP1 (2 μg/ml). GAPDH was used as a loading control. E Flow cytometry analysis of PD-L1 expression on WT, Aebp1-/-, or SC79 (20 μM) treated Aebp1-/- CAFs, p < 0.0001. F The binding status of AEBP1 and CKAP4 in hCAFs or mCAFs based on IP. G IF showed representative images of AEBP1 (red) and CKAP4 (green) in shNC and shCkap4 mCAFs, or CAFs treated with IgG or rmAEBP1 (1 μg/ml). Scale bar, 25 μm. H Construction of AEBP1 serial deletion mutants. I IP and western blot were performed to analyze the co-expression of CKAP4 with either AEBP1 or its deletion mutants in 293 T cells. J Western blot analysis of total AKT and p-AKT expression in shNC or shCKAP4 hCAFs treated with vehicle or rhAEBP1 (2 μg/ml). GAPDH was used as a loading control. K Flow cytometry analysis of PD-L1 expression in shNC or shCKAP4 hCAFs treated with vehicle or rhAEBP1 (2 μg/ml), p < 0.0001. Percentage of IFN-γ+ (L) or TNF-α+ (M) CD8+ T cells cocultured with shNC or shCkap4 mCAFs treated with vehicle or rmAEBP1 (1 μg/ml), p < 0.0001. n = 3 biological replicates (E, G, KM). Blot is representative of n = 2 biological replicates (C, D, F, I, J). Data are presented as the mean ± SEM, and were analyzed by one-way ANOVA with Tukey’s multiple comparisons test (E, KM). Source data are provided as a Source Data file.
Fig. 6
Fig. 6. Depletion of AEBP1 in CAFs improves the efficacy of ICT.
A MC38 tumor growth and survival analysis of IgG or anti-CTLA-4-treated WT and AEBP1 cKO mice. n = 5 mice/group for tumor volume analysis; n = 7 mice/group for survival analysis; log-rank test for survival comparison. Percentage of IFN-γ+ (B),TNF-α+ (C) CD8+ T cells in MC38 tumors from IgG, Aebp1 cKO, anti-CTLA-4, and the combination groups (n = 5 mice/group). D EO771 tumor growth and survival analysis of IgG or anti-PD-1-treated WT and Aebp1 cKO mice. n = 5 mice/group for tumor volume analysis; n = 7 mice/group for survival analysis; log-rank test for survival comparison. Percentage of IFN-γ+ (E),TNF-α+ (F) CD8+ T cells in EO771 tumors from IgG, Aebp1 cKO, anti-PD-1, and the combination groups (n = 5 mice/group). Data are presented as the mean ± SEM (AF), and were analyzed by two-way (A, D) or one-way ANOVA (B, C, E, F) with Tukey’s multiple comparisons test. Source data are provided as a Source Data file.
Fig. 7
Fig. 7. Chem-0199 suppresses the interaction between AEBP1 and CKAP4.
A Workflow of inhibitor screening. Created in BioRender. Xiaoyu, W. (2025) https://BioRender.com/s97i4nk. B Overall structures of AEBP1 (shown in silver) and CKAP4 (shown in pink). The figure demonstrates the formation of a hydrogen bond (represented by yellow dashed lines) between the amino acid Tyr874 in the AEBP1 protein and the amino acid Gln527 in the CKAP4 protein. C Close-up views of AEBP1-Chem-0199 complexes. The figure illustrates the competitive binding of Chem-0199 to AEBP1, forming hydrogen bonds and π-π interactions specifically with the amino acid Tyr874 in the AEBP1 protein. The green arrows indicate Chem-0199. Two perpendicular views are shown. D Western blot analysis of total AKT and p-AKT expression in vehicle or Chem-0199 treated WT and Aebp1-/- CAFs. GAPDH was used as a loading control. Blot is representative of n = 2 biological replicates. E Flow cytometry analysis of PD-L1 expression on vehicle or Chem-0199 treated WT and Aebp1-/- mCAFs. F Percentage of IFN-γ+ CD8+ T cells cocultured with WT and Aebp1-/- mCAFs treated with vehicle or Chem-0199. G MC38 tumor growth of vehicle or Chem-0199-treated WT and Aebp1 cKO mice. H Tumor growth of MC38 tumor-bearing WT mice treated with Chem-0199 alone, anti-CTLA-4 alone, or Chem-0199 + anti-CTLA-4. Percentage of IFN-γ+ (I) or TNF-α+ (J) CD8+ T cells in MC38 tumors from mice treated with indicated regimens, p < 0.0001. n = 3 biological replicates (E, F), n = 5 mice/group (GJ). Data are presented as the mean ± SEM (EJ), and were analyzed by one-way (E, F, I, J) or two-way ANOVA (G, H) with Tukey’s multiple comparisons test. Source data are provided as a Source Data file.
Fig. 8
Fig. 8. Schematic illustration of the mechanism by which CAF-derived AEBP1 induces T cell dysfunction in tumors.
CAF-derived AEBP1 activates the CKAP4/AKT/PD-L1 pathway, then leads to T cell dysfunction. Chem-0199, an AEBP1 inhibitor, disrupts the AEBP1-CKAP4 complex, suppresses the activation of Akt pathway and PD-L1 expression in CAFs, and finally enhances the cytotoxic activity of CD8+ T cells. Furthermore, genetic or pharmaceutical inhibition of AEBP1 synergizes with ICT.

References

    1. Thommen, D. S. & Schumacher, T. N. T cell dysfunction in cancer. Cancer Cell33, 547–562 (2018). - PMC - PubMed
    1. Paijens, S. T., Vledder, A., de Bruyn, M. & Nijman, H. W. Tumor-infiltrating lymphocytes in the immunotherapy era. Cell Mol. Immunol.18, 842–859 (2021). - PMC - PubMed
    1. Biffi, G. & Tuveson, D. A. Diversity and biology of cancer-associated fibroblasts. Physiol. Rev.101, 147–176 (2021). - PMC - PubMed
    1. Vinay, D. S. et al. Immune evasion in cancer: mechanistic basis and therapeutic strategies. Semin. Cancer Biol.35, S185–S198 (2015). - PubMed
    1. Mao, X. et al. Crosstalk between cancer-associated fibroblasts and immune cells in the tumor microenvironment: new findings and future perspectives. Mol. Cancer20, 131 (2021). - PMC - PubMed

MeSH terms

LinkOut - more resources