. 2025 Sep 1;15(1):32173.
doi: 10.1038/s41598-025-12021-7.

Benchmarking of dimensionality reduction methods to capture drug response in transcriptome data

Affiliations

Benchmarking of dimensionality reduction methods to capture drug response in transcriptome data

Yuseong Kwon et al. Sci Rep. .

Abstract

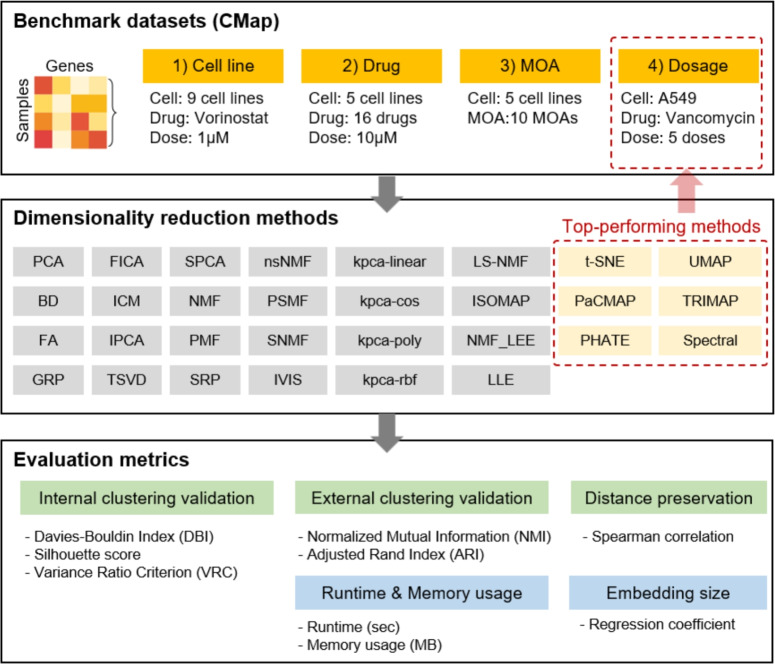
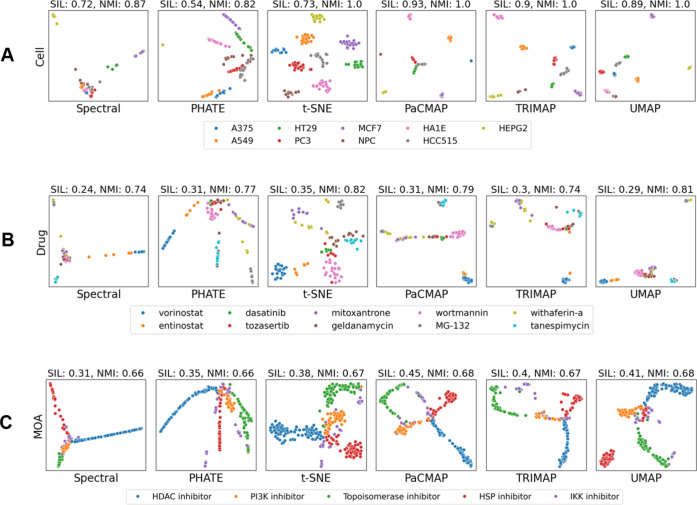
Drug-induced transcriptomic data are crucial for understanding molecular mechanisms of action (MOAs), predicting drug efficacy, and identifying off-target effects. However, their high dimensionality presents challenges for analysis and interpretation. Dimensionality reduction (DR) methods simplify such data, enabling efficient analysis and visualization. Despite their importance, few studies have evaluated the performance of DR methods specifically for drug-induced transcriptomic data. We tested the DR methods across four distinct experimental conditions using data from the Connectivity Map (CMap) dataset, which includes different cell lines, drugs, MOA, and drug dosages. t-distributed Stochastic Neighbor Embedding (t-SNE), Uniform Manifold Approximation and Projection (UMAP), Pairwise Controlled Manifold Approximation (PaCMAP), and TRIMAP outperformed other methods in preserving both local and global biological structures, particularly in separating distinct drug responses and grouping drugs with similar molecular targets. However, most methods struggled with detecting subtle dose-dependent transcriptomic changes, where Spectral, Potential of Heat-diffusion for Affinity-based Trajectory Embedding (PHATE), and t-SNE showed stronger performance. Standard parameter settings limited the optimal performance of DR methods, highlighting the need for further exploration of hyperparameter optimization. Our study provides valuable insights into the strengths and limitations of various DR methods for analyzing drug-induced transcriptomic data. While t-SNE, UMAP, and PaCMAP are well-suited for studying discrete drug responses, further refinement is needed for detecting subtle dose-dependent changes. This study highlights the importance of selecting the DR method to accurately analyze drug-induced transcriptomic data.

Keywords: CMap data; Dimension reduction; Drug-induced transcriptome; RNA-seq analysis.


Conflict of interest statement

Declarations. Competing interests: The authors declare no competing interests.

Figures

Figure 1
Figure 1
The CMap drug-induced transcriptomic data were categorized into four benchmark sets. Various DR algorithms were evaluated using six performance metrics, including clustering validity and distance preservation. Additional assessments included sensitivity to embedding dimension, computational runtime, and memory usage.
Figure 2
Figure 2
Performance evaluation of 30 DR methods using internal and external cluster validation metrics across three distinct benchmark set.(A) Normalized scores for internal validation metrics (DBI, Sil, and VRC) for 30 DR methods (columns) across three experimental condition datasets (rows). Scores were min-max normalized for each dataset. DR methods are ranked based on the average of the three metrics within each dataset. (B) Scores for external validation metrics (ARI and NMI) across the for 30 DR methods (columns) across datasets (rows). DR methods are ranked by the average of these two metrics within each dataset. (C) A comparison of Sil and NMI scores of individual DR methods across dataset. DR methods that achieved the highest rankings in both scores are highlighted within the red box in the upper right corner.
Fig. 3
Fig. 3
Two-dimensional (2D) visualizations of reduced dimensional space derived by the top six DR methods for three distinct experimental condition datasets involving different cell lines (A), drugs (B), or MOAs (C). For each plot, Sil and NMI scores are displayed in the upper corner. The legends on the right indicate the biological labels of the samples in each dataset.
Fig. 4
Fig. 4
Spearman correlation coefficient values of pairwise distances between samples in the original and reduced-dimensional space for the top six DR methods across datasets. High correlation values indicate a strong preservation of the original data structure in the reduced-dimensional space, reflecting the effectiveness of each DR method in maintaining both local and global relationships between samples.
Fig. 5
Fig. 5
The impact of embedding size on clustering accuracy for the top six DR methods. The NMI scores for the top six DR methods across five embedding sizes (2, 4, 8, 16, and 32) are displayed for three datasets. These DR methods are categorized into stable and decreasing groups based on the relationship between embedding size and NMI scores, as determined by regression analysis.
Fig. 6
Fig. 6
The performance of the top six DR methods for differentiating drug dosages. (A) Bar plots depicting three evaluation metrics (Silhouette, NMI, and Spearman correlation) for the six DR methods applied to vancomycin-induced transcriptome data across varying dosages. (B) Two-dimensional visualizations of the reduced-dimensional space after applying the top six DR methods. For each plot, the Sil and NMI score are displayed in the upper corner. The legends on the right indicate the treatment concentration (formula imageM) of the samples.
Fig. 7
Fig. 7
Overall performance of the six DR methods using three evaluation metrics (Sil, NMI, and Spearman) across four distinct benchmark datasets (Cell, Drug, MOA, and Dose). Methods are sorted from highest to lowest based on their performance for each metric, with darker colors representing better scores.

Similar articles

References

    1. Iorio, F., Rittman, T., Ge, H., Menden, M. & Saez-Rodriguez, J. Transcriptional data: A new gateway to drug repositioning?. Drug Discov. Today18, 350–357 (2013). - PMC - PubMed
    1. Kwon, O.-S., Kim, W., Cha, H.-J. & Lee, H. In silico drug repositioning: From large-scale transcriptome data to therapeutics. Arch. Pharmacal Res.42, 879–889 (2019). - PubMed
    1. Yang, Y. et al. Dimensionality reduction by umap reinforces sample heterogeneity analysis in bulk transcriptomic data. Cell Rep.36 (2021). - PubMed
    1. Vidman, L., Källberg, D. & Rydén, P. Cluster analysis on high dimensional rna-seq data with applications to cancer research-an evaluation study. PLoS ONE14, e0219102 (2019). - PMC - PubMed
    1. Park, M. et al. Kore-map 1.0: Korean medicine omics resource extension map on transcriptome data of tonifying herbal medicine.. Sci. Data11, 974 (2024). - PMC - PubMed

LinkOut - more resources