. 2025 Sep 1;15(1):32175.
doi: 10.1038/s41598-025-14961-6.

Correspondence of high dimensional emotion structures elicited from video clips between humans and multimodal LLMs

Affiliations

Correspondence of high dimensional emotion structures elicited from video clips between humans and multimodal LLMs

Haruka Asanuma et al. Sci Rep. .

Abstract

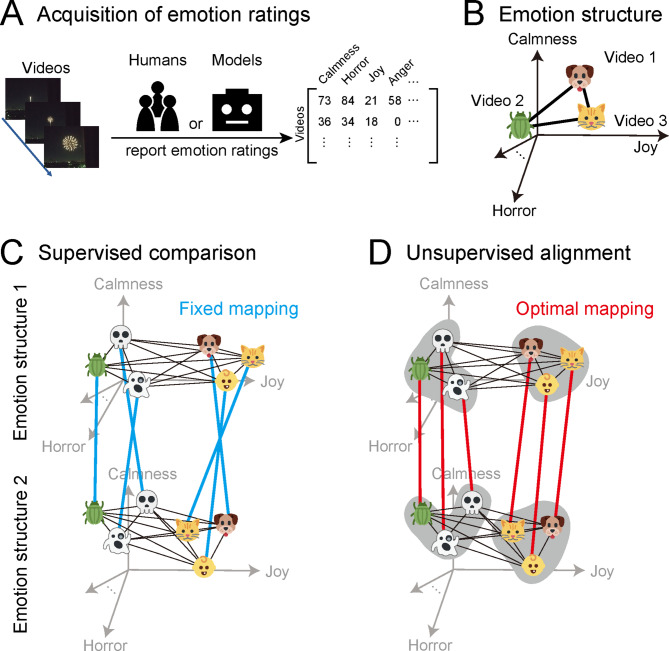
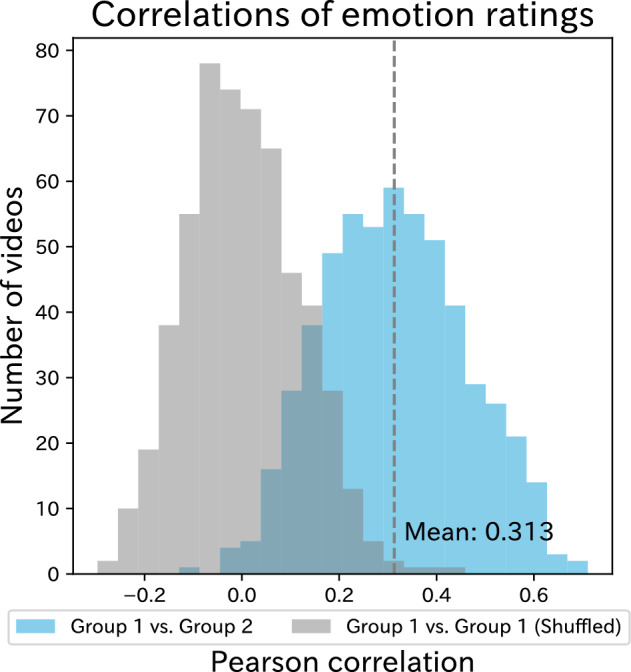
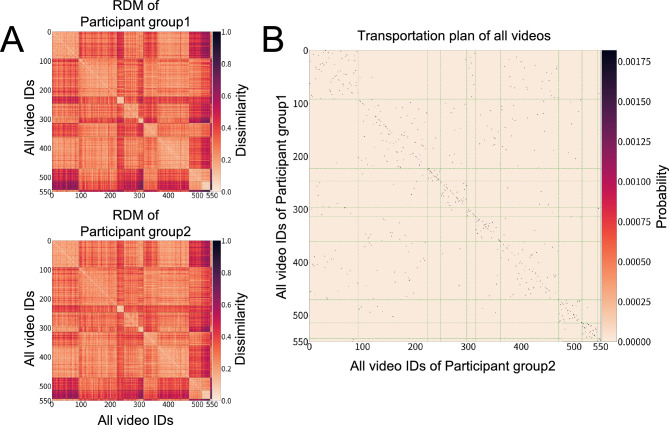
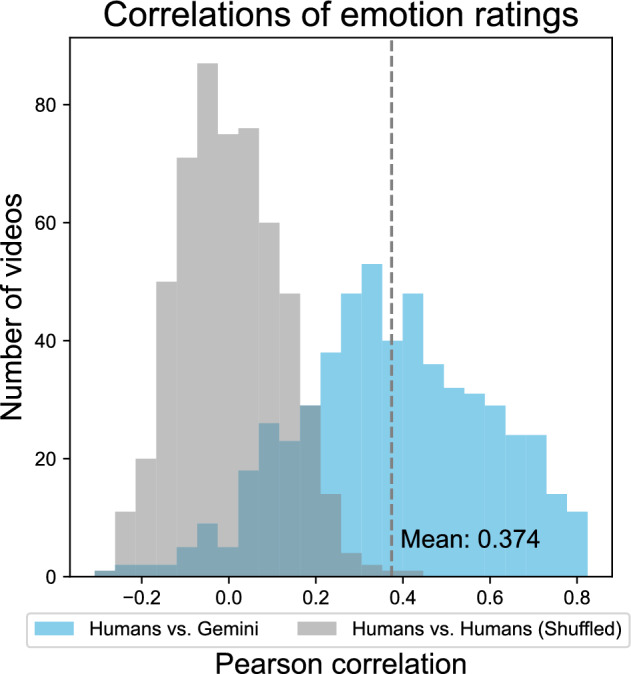
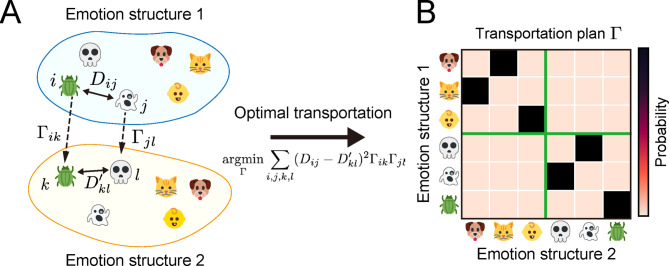
Recent studies have revealed that human emotions exhibit a high-dimensional, complex structure. A full capturing of this complexity requires new approaches, as conventional models that disregard high dimensionality risk overlooking key nuances of human emotions. Here, we examined the extent to which the latest generation of rapidly evolving Multimodal Large Language Models (MLLMs) capture these high-dimensional, intricate emotion structures, including capabilities and limitations. Specifically, we compared self-reported emotion ratings from participants watching videos with model-generated estimates (e.g., Gemini or GPT). We evaluated performance not only at the individual video level but also from emotion structures that account for inter-video relationships. At the level of simple correlation between emotion structures, our results demonstrated strong similarity between human and model-inferred emotion structures. To further explore whether the similarity between humans and models is at the signle-item level or the coarse-category level, we applied Gromov-Wasserstein Optimal Transport. We found that although performance was not necessarily high at the strict, single-item level, performance across video categories that elicit similar emotions was substantial, indicating that the model could infer human emotional experiences at the coarse-category level. Our results suggest that current state-of-the-art MLLMs broadly capture the complex high-dimensional emotion structures at the coarse-category level, as well as their apparent limitations in accurately capturing entire structures at the single-item level.

Keywords: Emotion; Emotion structure; Gromov-Wasserstein Optimal Transport; Multimodal Large Language Model; Representational Similarity Analysis; Unsupervised alignment.


Conflict of interest statement

Declarations. Competing interests: The authors declare no competing interests.

Figures

Fig. 1
Fig. 1
Overview of the analytical framework for comparing similarity structures of emotions across two domains (e.g., humans vs. model). A Acquisition of emotion ratings. Participants and models watch a series of video clips and report emotion ratings on multiple dimensions, such as calmness, joy, horror, anger. The elements of the matrix represent the intensity of each emotion category for each video reported by participants or models. B Emotion structures. Each video’s emotion ratings, as reported by humans and models, are represented as points in a multidimensional space to illustrate the relational structure of emotions (emotion structure). The points corresponding to videos that evoke similar emotional responses, such as Video 1 (dog) and Video 3 (cat) associated with joy, are positioned closer together, while videos eliciting distinct emotions, such as Video 2 (insect) associated with horror, are placed further apart. Dissimilarity between videos is represented by distance, namely the black lines between points. C Supervised comparison of emotion structures. Supervised comparison of emotion structures between two domains based on fixed mapping between the same videos, which is represented by blue lines. D Unsupervised comparison of emotion structures. A conceptual illustration of unsupervised comparison based on Gromov-Wasserstein Optimal Transport (GWOT), which searches for optimal mappings based solely on internal relations (RDMs). The optimal mappings are shown as red lines. In the figure, groups of videos that evoke similar emotions (categories) are surrounded by gray outlines. In this case, the mappings are categorical but not exact at the fine-item level, e.g., ghost is mapped to skull and dog is mapped to cat, but these are appropriately paired within the same category. Emoji graphics from Twemoji, licensed under CC BY 4.0 by Twitter, Inc. and other contributors (https://creativecommons.org/licenses/by/4.0/).
Fig. 2
Fig. 2
Histogram of the Pearson correlation for each video clip between human ratings in the Koide-Majima et al. dataset. The blue histogram represents the distribution of the correlation between the ratings of Participant group 1 and group 2 participants for each video, and the gray histogram represents the distribution of the correlation between the Participant group 1 ratings and the shuffled Participant group 1 ratings, which served as the null distribution. The dashed line represents the mean of the correlation, 0.313, between the ratings of Participant group 1 and group 2 (blue histogram).
Fig. 3
Fig. 3
Unsupervised comparison of the similarity structures for all videos in the Koide-Majima et al. dataset between Participant group 1 and group 2 based on Gromov-Wasserstein Optimal Transport (GWOT). A Representational Dissimilarity Matrices (RDMs) of Participant group 1 and group 2. The elements of the RDMs represent the dissimilarity between the emotion ratings of the videos, quantified by cosine similarity. B Optimal transportation plan obtained by GWOT between the RDMs of Participant group 1 and group 2. Green lines represent the category boundaries of the videos.
Fig. 4
Fig. 4
The histograms show the Pearson correlation of each video clip between the human ratings and Gemini’s estimation in the Koide-Majima et al. dataset. The blue histogram represents the distribution of the correlation between the human ratings and the Gemini’s estimation for each video, and the gray histogram represents the distribution of the correlation between the human ratings and the shuffled human ratings, which served as the null distribution. The dashed line represents the mean of the correlation, 0.374, between the human ratings and the Gemini’s estimation (the blue histogram).
Fig. 5
Fig. 5
Unsupervised comparison of human similarity structures of videos in the Koide-Majima et al. dataset with similarity structures estimated by Gemini based on Gromov-Wasserstein Optimal Transport (GWOT). A The Representational Dissimilarity Matrices (RDMs) of the human participants and Gemini. The elements of the RDMs represent the dissimilarity between the emotion ratings of the videos, quantified by cosine similarity. B Optimal transportation plan obtained by GWOT between the human and Gemini RDMs. Green lines represent the category boundaries of the videos. C Optimal transportation plan for the selected top 100 videos. D Optimal transportation plan for the selected top 250 videos.
Fig. 6
Fig. 6
Comparison of the human similarity structures of videos in the Cowen & Keltner dataset with the similarity structures estimated by Gemini. A Histograms of the Pearson correlation of each video clip between the human ratings and Gemini’s estimation. The blue histogram represents the distribution of correlation between the human ratings and Gemini’s estimation for each video, and the gray histogram represents the distribution of correlation between the human ratings and the shuffled human ratings, which served as the null distribution. The dashed line represents the mean of the correlation, 0.553, between the human ratings and Gemini’s estimation (blue histogram). B Representational Dissimilarity Matrices (RDMs) of the human participants and Gemini. The elements of the RDMs represent the dissimilarity between the emotion ratings of the videos, quantified by cosine similarity. C Optimal transportation plan obtained for the selected top 250 videos by GWOT between the human and Gemini RDMs. Green lines represent the category boundaries of the videos. D Optimal transportation plan for the selected top 750 videos.
Fig. 7
Fig. 7
Schematic of the Gromov–Wasserstein optimal transport. A Each element of D and formula image represents the dissimilarity between the emotion ratings of the videos. The optimal transportation plan formula image is obtained by minimizing the Gromov-Wasserstein distance (GWD) between the two emotion structures. B The obtained transportation plan matrix formula image. Each cell formula image represents the probability of correspondence between the two videos i and j. Emoji graphics from Twemoji, licensed under CC BY 4.0 by Twitter, Inc. and other contributors (https://creativecommons.org/licenses/by/4.0/).

References

    1. Cowen, A. S. & Keltner, D. Self-report captures 27 distinct categories of emotion bridged by continuous gradients. Proc. Natl. Acad. Sci. U. S. A.114, E7900–E7909 (2017). - PMC - PubMed
    1. Koide-Majima, N., Nakai, T. & Nishimoto, S. Distinct dimensions of emotion in the human brain and their representation on the cortical surface. Neuroimage222, 117258 (2020). - PubMed
    1. Ekman, P. & Friesen, W. V. Constants across cultures in the face and emotion. J. Pers. Soc. Psychol.17, 124–129 (1971). - PubMed
    1. Russell, J. A. A circumplex model of affect. J. Pers. Soc. Psychol.39, 1161–1178 (1980).
    1. Russell, J. A. & Barrett, L. F. Core affect, prototypical emotional episodes, and other things called emotion: dissecting the elephant. J. Pers. Soc. Psychol.76, 805–819 (1999). - PubMed

LinkOut - more resources