. 2025 Oct;5(10):2070-2085.
doi: 10.1038/s43587-025-00950-x. Epub 2025 Sep 1.

REV-ERBα regulates brain NAD+ levels and tauopathy via an NFIL3-CD38 axis

Affiliations

REV-ERBα regulates brain NAD+ levels and tauopathy via an NFIL3-CD38 axis

Jiyeon Lee et al. Nat Aging. 2025 Oct.

Abstract

Nicotinamide adenine dinucleotide (NAD+) is a critical metabolic co-enzyme implicated in brain aging, and augmenting NAD+ levels in the aging brain is an attractive therapeutic strategy for neurodegeneration. However, the molecular mechanisms of brain NAD+ regulation are incompletely understood. In cardiac tissue, the circadian nuclear receptor REV-ERBα has been shown to regulate NAD+ via control of the NAD+-producing enzyme NAMPT. Here we show that REV-ERBα controls brain NAD+ levels through a distinct pathway involving NFIL3-dependent suppression of the NAD+-consuming enzyme CD38, particularly in astrocytes. REV-ERBα deletion does not affect NAMPT expression in the brain and has an opposite effect on NAD+ levels as in the heart. Astrocytic REV-ERBα deletion augments brain NAD+ and prevents tauopathy in P301S mice. Our data reveal that REV-ERBα regulates NAD+ in a tissue-specific manner via opposing regulation of NAMPT versus CD38 and define an astrocyte REV-ERBα-NFIL3-CD38 pathway controlling brain NAD+ metabolism and neurodegeneration.


Conflict of interest statement

Competing interests: The authors declare no competing interests.

Figures

Fig. 1
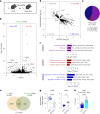
Fig. 1. REV-ERBα deletion suppresses the NAD+-consuming enzyme CD38 and enhances brain NAD+ levels.
a, Schematic showing experiments with inducible global REV-ERBα KO mice (CAG::CreERT2;Nr1d1fl/fl mice, termed RKO). TAM, tamoxifen. b, Cre expression (WT, n = 13 mice; RKO, n = 17 mice) and Nr1d1 (REV-ERBα) deletion efficiency (WT, n = 14 mice; RKO, n = 18 mice) in RKO (Cre+) compared to WT (Cre) mouse brain. c, Volcano plot showing differential gene expression from WT and RKO hippocampus (log2FC cutoff = 0.5, −log10 (P value) cutoff = 1.3, corresponds to P value of 0.05 using limma-voom). d, Top five upregulated or downregulated biological processes identified for DEGs in REV-ERBα KO brain from bulk RNA-seq. e, Heatmap representing genes from ‘Cation transport; upregulation’ and ‘Steroid metabolic process; downregulation’. Nfil3 and Cd38 are noted with red asterisks. f, Expression of Nfil3 and Cd38 from WT and RKO hippocampus by qPCR (WT, n = 12 mice; RKO, n = 9 mice). g, Increased NAD+ levels in RKO cerebral cortex compared to WT (WT, n = 12; RKO, n = 13). h, Transcripts of three major NAD+-consuming enzymes, Sirt1, Parp1 and Cd38, in WT and RKO hippocampus (from RNA-seq data in c). i, Nampt expression in hippocampal tissue is unchanged in RKO group compared to WT group (WT, n = 12 mice; RKO, n = 9 mice, qPCR). j, Expression of Nfil3 transcript in Arc nucleus from control (n = 4 mice) and hypothalamic REV-ERB α/β KO brain (H-DKO, n = 5 mice) and cardiomyocyte-specific REV-ERBα/β KO heart (CM-DKO, n = 3 mice per group). k, Cd38 and Nampt transcript expression in Arc nucleus tissue from control (n = 4 mice) and hypothalamic REV-ERBα/β KO (H-DKO, n = 5 mice). l, Cd38 and Nampt transcript expression in heart tissue from control and cardiomyocyte REV-ERBα/β KO (CM-DKO) mice (n = 3 mice per group). m, Knockdown of Nfil3 with siNfil3 siRNA causes increased expression of Cd38 in primary mouse astrocyte cultures. Control siRNA is labeled as ‘siCon’. n, Diagram depicting proposed indirect regulation of CD38 and NAD+ by REV-ERBα via NFIL3 inhibition. Note that the NFIL3–NAMPT interaction is minimal in brain but predominates in heart. **P < 0.01, ***P < 0.005, ****P < 0.001; ‘NS’ is non-significant by two-tailed t-test. Error bars represent mean ± s.e.m. ptn, protein. Source data
Fig. 2
Fig. 2. REV-ERBα deletion activates the NFIL3–CD68 axis to increase brain NAD+ levels and improves inflammatory and synaptic gene expression in PS19 tauopathy mice.
a, Schematic showing 10-month-old Cre;P301S tau+ (PS19) and Cre+;P301S+ RKO (PS19;RKO) mice. b, Volcano plot showing differential gene expression from PS19 and PS19;RKO brains (log2FC cutoff = 0.5, −log10 (P value) cutoff = 1.3, corresponds to P value of 0.05 using limma-voom). Left side indicates genes increased in PS19; right side indicates genes increased in PS19;RKO. c, Venn diagram analysis showing DEGs that were differentially expressed in PS19/WT and PS19;RKO/PS19, indicating regulation by both tau and REV-ERBα. d, Division of the 1,344 DEGs from c into four groups: ‘a’, increased by RKO but not tau; ‘b’, increased by tau and further by RKO; ‘c’, decreased by RKO and by tau; ‘d’, increased by tau and decreased by RKO. e, Pie chart showing proportion of the 1,344 DEGs in each group. f, Top three Gene Ontology functional enrichment results for each group of DEGs except group ‘c’. RKO rescued tau-mediated downregulation of synaptic genes, enhanced tau-mediated expression of protein catabolism genes and reduced tau-mediated inflammatory gene expression. g, REV-ERBα KO increased Nfil3 (n = 10 mice) and suppressed Cd38 expression (n = 8 mice) in PS19 mouse brain. h, Increased NAD+ levels in PS19;RKO mice brain compared to PS19 (PS19, n = 15 mice; PS19;RKO, n = 16 mice). **P < 0.01, ****P < 0.001; ‘NS’ is non-significant by two-tailed t-test or two-way ANOVA with Sidakʼs multiple comparisons test. Error bars represent mean ± s.e.m. ptn, protein. Source data
Fig. 3
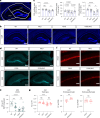
Fig. 3. Tau deposition and glial activation in PS19 mouse brain are ameliorated by REV-ERBα deletion.
a, pTau and aggregated/misfolded tau were stained by AT8 and MC1 antibodies, respectively, in hippocampus (HIP) and entorhinal cortex (EC). Percent area positive for each staining was quantified (PS19, n = 9 mice; PS19;RKO, n = 11 mice). Scale bars, 500 μm. b,c, Representative images of activated astrocytes (GFAP, cyan), total microglia (IBA1, red) and activated microglia (CD68, green) in PS19 and PS19;RKO mouse CA3 region (b) and EC (c) with quantification (PS19, n = 9 mice; PS19;RKO, n = 12 mice). Scale bars, 500 μm. d, Graphs depicting expression of eight genes in PS19 versus PS19;RKO HIP, including a REV-ERBα target (Fabp7) as well as genes involved in glial activation (Gfap, Aif1and Cd68), inflammation (Il1b and Tnf) and lipid metabolism (Apoe and Plin2). *P < 0.05, **P < 0.01, ***P < 0.005, ****P < 0.001; ‘NS’ is non-significant by two-tailed t-test. Error bars represent mean ± s.e.m. Source data
Fig. 4
Fig. 4. Hippocampal volumes and CA1 thickness in PS19 mouse brain are improved by REV-ERBα deletion.
a, Schematic showing compartmentation of mouse hippocampus region into the CA1, CA3 and dentate gyrus (DG) based on DAPI staining. b, Representative images of DAPI staining from four different groups (WT, RKO, PS19 and PS19;RKO). Scale bars, 500 μm. c, Quantification of DAPI percent area in CA1, CA3 and DG compartments in all four genotypes of mice showing loss in PS19 mice, which is rescued in PS19;RKO mice in two regions (WT, n = 8; RKO, n = 14; PS19; n = 10, PS19;RKO, n = 12 mice). d,e, Representative images showing SPO (cyan) staining in all four groups (WT, RKO, PS19 and PS19;RKO) (d) and quantification showing mild synapse loss in RKO and more severe in PS19 without rescue by REV-ERBα deletion (WT, n = 8; RKO, n = 14; PS19; n = 10, PS19;RKO, n = 12 mice) (e). Scale bars, 500 μm. f,g, NeuN staining of four groups to measure CA1 thickness (f) and quantification showing CA1 thinning in PS19 mice that is rescued by REV-ERBα deletion specifically in males (WT, n = 8; RKO, n = 14; PS19; n = 10, PS19;RKO, n = 12 mice) (g). Scale bars, 50 μm. *P < 0.05, **P < 0.01, ***P < 0.005, ****P < 0.001; ‘NS’ is non-significant by two-way ANOVA with Sidakʼs multiple comparisons test. Error bars represent mean ± s.e.m. Source data
Fig. 5
Fig. 5. REV-ERBα–NFIL3–CD38 axis controls astrocyte NAD+ levels.
a, Mouse model of astrocyte-specific REV-ERBα KO (ARKO, Aldh1l1-CreERT2;Nr1d1fl/fl). b, Astrocyte-specific REV-ERBα KO mice (ARKO) show increased expression of known downstream REV-ERBα target transcripts, including Fabp7 and Bmal1 in the cortex after tamoxifen treatment, compared to Cre littermates (WT) (n = 6 mice per group). c, Comparing hippocampal Cd38 expression across three different tissue-specific REV-ERBα KO mouse lines: global (RKO; CAG-CreERT2, n = 9 mice; paired WT, n = 12 mice), astrocyte (ARKO; Aldh1l1-CreERT2, n = 6; paired WT mice, n = 6 mice) and microglia (MRKO; Cx3cr1-CreERT2, n = 10 mice; paired WT, n = 12 mice). d, Increased brain NAD+ levels in ARKO mice (n = 9; paired WT, n = 8). e, AT8+ pTau pathology in hippocampus (HIP) and entorhinal cortex (EC) of PS19 and PS19;ARKO mice at 9 months. Scale bars, 500 μm. f, Hippocampal AT8 percent area from d (PS19, n = 11 mice; PS19;RKO, n = 8 mice). g, Expression of transcripts related to astrocyte (Gfap) and microglial (Iba1/Aif1 and Cd68) activation in HIP of WT, ARKO, PS19 and PS19;ARKO mice (WT, n = 8; ARKO, n = 9; PS19, n = 7; PS19;ARKO, n = 7). h, Cd38 mRNA levels in all four groups (n = 6 mice per genotype). i, Similar brain NAD+ levels between PS19 and PS19;ARKO mice at 9 months (PS19, n = 10; PS19;ARKO, n = 8). *P < 0.05, **P < 0.01, ***P < 0.005, ****P < 0.001; ‘NS’ is non-significant by two-tailed t-test or two-way ANOVA with Sidakʼs multiple comparisons test. Error bars represent mean ± s.e.m. EC, entorhinal cortex; HIP, hippocampus; ptn, protein. Source data
Fig. 6
Fig. 6. Cd38 knockdown in astrocytes enhances tau phagocytosis and lysosomal activity.
a, Effect of siRNA treatment with control (siCon) or Nr1d1 (siNr1d1) siRNA in primary astrocyte cultures on Nr1d1 and Cd38 transcript levels (n = 14 from biological replicates). b, NAD+ levels in siCon- or siNr1d1-treated cultured primary astrocytes (n = 6 from biological replicates). c, Knockdown efficiency of siCd38 siRNA on Cd38 mRNA in cultured primary astrocytes (n = 6 from biological replicates). d, Increased NAD+ levels in siCd38-transfected cultured primary astrocytes (n = 6 biological replicates). e, Graphic showing experimental strategy for DQ-Red BSA assay using Cyto D, an actin polymerization inhibitor that blocks phagocytosis. f, Cyto D treatment (20 μM) significantly reduced the DQ BSA+ astrocyte population (non-stain, n = 6; DQ BSA, n = 9; DQ BSA + Cyto D, n = 9 from biological triplicates). g, Knockdown of Cd38 in primary astrocyte cultures increased the DQ BSA+ population compared to control group (n = 9 plates from three mice). Non-treat group did not receive DQ-BSA. h, Engulfment of FITC-tau aggregates was increased in siCd38-treated primary astrocytes (non-treat, n = 4; siCon, n = 7; siCD38, n = 7 plates from three mice). Typical flow cytometry output as well as both mean fluorescence intensity (MFI) and %FITC+ astrocytes are shown. Non-treat group did not receive FITC-tau. **P < 0.01, ***P < 0.005 and ****P < 0.001 by two-tailed t-test or two-way ANOVA with Sidakʼs multiple comparisons test. Error bars represent mean ± s.e.m. ptn, protein. Source data
Fig. 7
Fig. 7. Inhibition of REV-ERBα function with SR8278 improves tau pathology.
a,b, Hippocampal staining of pTau (AT8) (VEH, n = 6 mice; SR8278, n = 6 mice) (a) or aggregated tau (MC1) in piriform cortex (VEH, n = 3 mice; SR8278, n = 4 mice) (b) in PS19 mice treated daily from age 8.5 months to 9.0 months with VEH or SR8278. Scale bars, 500 μm. Dotted lines in b indicate borders of piriform cortex. c, Heatmap showing gene expression changes in PS19 mouse brain from VEH-treated and SR8278-treated mice. d, Individually plotted genes showing diminished neuroinflammation as well as the increased Bmal1 expression after SR8278 treatment compared to VEH group (n = 3 mice per group). e, Representative images showing reduced microglial activation (IBA1, red) and astrogliosis (GFAP, green) in cortex of VEH versus SR8278 mice, with quantification (VEH, n = 3 mice; SR8278, n = 4 mice). Scale bars, 500 μm. f, NAD+ levels in cortex from VEH-treated or SR8278-treated mice (VEH, n = 6 mice; SR8278, n = 7 mice). *P < 0.05, **P < 0.01; ‘NS’ is non-significant by two-tailed t-test. Error bars represent mean ± s.e.m. Source data
Extended Data Fig. 1
Extended Data Fig. 1. Dampened Cd38 mRNA and protein expression on Rev-erbα knock-out (KO) mouse hippocampus across the day.
(a) Tamoxifen treated global REV-ERBα KO mice (CAG::CreERT2; Nr1d1fl/fl; RKO) and Cre- controls (WT) were sacrificed every 6 hours over a 24-hour period under standard 12 h:12 h light:dark conditions and gene expression was assayed using hippocampal tissue. Cd38 transcript did not vary by time of day, but was decreased at all timepoints (except 12 pm). A known target of REV-ERBα mediated repression, Fabp7, was highly induced compared to WT (Cre-) at all timepoints. N = 3 mice/genotype/ in each time point. (b) Lower level of CD38 protein in RKO hippocampus than WT at 12 pm (WT, n = 5; RKO, n = 4 mice). *p < 0.05, **p < 0.01, and ****p < 0.001 by 2-tailed T-test. Error bars represent mean ± SEM. Source data
Extended Data Fig. 2
Extended Data Fig. 2. REV-ERBβ (Nr1d2) knockdown does not alter Cd38 expression in primary astrocytes.
Knockdown of Nr1d2 (REV-ERBβ) by siRNA transfection in cultured primary astrocytes induces Bmal1, has a small effect on Nfil3 transcript levels, but Cd38 does not significantly change (siControl, n = 7; siNr1d2, n = 7 plates from two mice). **p < 0.01, ****p < 0.001, and ns is non-significant by 2-tailed T-test. Error bars represent mean ± SEM. Source data
Extended Data Fig. 3
Extended Data Fig. 3. Identification of 12 binding motifs for NFIL3 in Cd38 genomic region.
(a) scATAC-seq peak cCREs353987 was specific to astrocytes from the mouse brain white and grey matter as well as cerebral nuclei (or basal ganglia). It is located at the 5’ TSS of Cd38 genomic region. Multiple putative low-affinity binding sites of the transcription factor NFIL3 (motif M01819 from CIS-BP database) were detected within the peak cCREs353987. Furthermore, multiple lines of evidence from three additional databases support the functionality of this genomic region including the Mouse ATAC-seq Atlas database, DNase-seq data from the Cistrome database as well as the ENCODE cCREs database from ENCODE project. (b) The score represents the binding affinity of NFIL3 to the putative NFIL3 finding sites. (c) The sequence alignment logo of the 12 NFIL3 binding sites.
Extended Data Fig. 4
Extended Data Fig. 4. Nmnat3 is induced by REV-ERBα deletion in the hippocampus, but not in the heart tissue.
(a) Comparing mRNA expression of NAD+ metabolic enzymes and (b) NAD+ level between WT (Cre-) and RKO (Cre + ) hippocampus (WT, n = 16; RKO, n = 16 mice). (c) Nmnat3 is not altered in heart tissue in global RKO mice, while both Nampt and Sarm1 are decreased (WT, n = 4; RKO, n = 4 mice). *p < 0.05 and ns is non-significant by 2-tailed T-test. Error bars represent mean ± SEM. Source data
Extended Data Fig. 5
Extended Data Fig. 5. Principal component analysis (PCA) and Volcano plots representing deregulated metabolites between WT (Cre-) and RKO (Cre + ) cortex.
(a) PCA plot of all the metabolite features (left) and differentially abundant metabolite features (right) between ‘Cre-’ and ‘Cre + ’ groups: Each point represents a sample, colored by ‘Cre-’ (Yellow) and ‘Cre + ’ (Blue). Ellipses represent 95% confidence intervals (95% CI) for each group. (b) 185 metabolite features are differentially abundant between the groups by p-value < 0.1. (c) Volcano plot of differentially abundant features: Each Point represents a metabolite feature in the analysis, with the x-axis showing the log2 fold change (Log2FC) between ‘Cre + ’ versus ‘Cre-’ and the y-axis representing the –log10 p-value. Points are colored in blue based on the NAD derivatives or related metabolites. Red horizontal lines indicate the significance threshold (Student T-test, p < 0.1), and the points above the line are considered marginally significant. Text labels are provided for the name of the 12 marginally significant NAD related metabolites.
Extended Data Fig. 6
Extended Data Fig. 6. PS19 mice exhibit increased inflammatory gene expression and decreased brain NAD+ levels.
(a) Volcano plot showing differentially gene expression (DEGs) from 10-months old WT vs. PS19 brains (Log2 fold changes cutoff = 0.5, −Log10 P-value cutoff = 1.3, corresponds to p-value of 0.05 using Limma-voom). (b) Top 5 upregulated or downregulated biological processes identified for DEGs from PS19 mouse brain from bulk RNA-sequencing. (c) NAD+ levels in PS19 mouse brain (n = 11 mice) compared to WT (n = 6 mice). **p < 0.01 by 2-tailed T-test. Error bars represent mean ± SEM. Source data
Extended Data Fig. 7
Extended Data Fig. 7. REV-ERBα KO does not affect levels of acetylated Tau (ac-Tau) in PS19 mice.
(a) Western blot analysis of pTau (AT8) protein in cortex samples from PS19 (n = 5 mice) and PS19;RKO (n = 5 mice) mouse brain samples. Each intensity value is normalized to total hTau (HT7) (n = 10 mice/group). (b) Representative western blot images showing the effect of REV-ERBα on total SIRT1 protein expression under both basal (WT, n = 10; RKO, n = 13 mice) and tau expressing condition (PS19, n = 13; PS19;RKO, n = 12 mice) in vivo. β-tubulin was used as a loading control. (n = 10-13 mice/group). (c) Western blot analysis of ac-Tau (K174, K274) protein in PS19 and PS19; RKO mouse brain samples. Each intensity value is normalized with total hTau (HT7) expression (n = 10-12). *p < 0.05, ****p < 0.001, and ns is non-significant by 2-tailed T-test. Error bars represent mean ± SEM. Source data
Extended Data Fig. 8
Extended Data Fig. 8. Glial markers in hippocampus and entorhinal cortex of PS19 and PS19/RKO.
(a) Representative images of activated astrocytes (GFAP: cyan), total microglia (IBA1: red), and activated microglia (CD68: green) in PS19 and PS19; RKO mouse whole hippocampus and (b) the entorhinal cortex (EC). (PS19, n = 9; PS19;RKO, n = 12 mice) Scale bars, 500 μm.
Extended Data Fig. 9
Extended Data Fig. 9. Global post-natal REV-ERBα deletion does not induce microglial activation but slightly decreases GFAP+ astrocytes.
(a) Representative images showing activated astrocytes (GFAP; cyan) and toal microglia (IBA1; red), and activated microglia (CD68; green) in WT and RKO mouse hippocampus and (b) quantification of % area for each marker, normalized to WT (WT, n = 6; RKO, n = 8 mice). (c) Immunofluorescent co-staining depicting S100β (red) and GFAP (green) in WT and RKO hippocampus. (d) Quantification of images in (c) (WT, n = 11; RKO, n = 12 mice). Scale bars, 500 μm (whole hippocampus); Scale bars, 50 µm (inset image). *p < 0.05, ***p < 0.005 and ns is non-significant by 2-tailed T-test. Error bars represent mean ± SEM. Source data
Extended Data Fig. 10
Extended Data Fig. 10. Hippocampal c-fos staining is not altered by REV-ERBα deletion in regular or PS19 mice.
(a) Representative images showing immuno-labelling for c-fos (green) and NeuN (red) in four different groups; WT, RKO, PS19, PS19;RKO with (b) quantification (% area normalized to Cre- control group, n = 12-17 mice per group). Scale bars, 500 μm (whole hippocampus); Scale bars, 50 µm (inset image). ns is non-significant by 2-tailed T-test. Error bars represent mean ± SEM. Source data

References

    1. Covarrubias, A. J., Perrone, R., Grozio, A. & Verdin, E. NAD+ metabolism and its roles in cellular processes during ageing. Nat. Rev. Mol. Cell Biol.22, 119–141 (2021). - PMC - PubMed
    1. Xie, N. et al. NAD+ metabolism: pathophysiologic mechanisms and therapeutic potential. Signal Transduct. Target. Ther.5, 227 (2020). - PMC - PubMed
    1. Lautrup, S., Sinclair, D. A., Mattson, M. P. & Fang, E. F. NAD+ in brain aging and neurodegenerative disorders. Cell Metab.30, 630–655 (2019). - PMC - PubMed
    1. Nakahata, Y., Sahar, S., Astarita, G., Kaluzova, M. & Sassone-Corsi, P. Circadian control of the NAD+ salvage pathway by CLOCK-SIRT1. Science324, 654–657 (2009). - PMC - PubMed
    1. Ramsey, K. M. et al. Circadian clock feedback cycle through NAMPT-mediated NAD+ biosynthesis. Science324, 651–654 (2009). - PMC - PubMed

MeSH terms

LinkOut - more resources