. 2025 Sep 1;15(1):32140.
doi: 10.1038/s41598-025-17845-x.

Construction of a prognostic risk model for acute myeloid leukemia based on exosomal genes and analysis of immune microenvironment characteristics

Affiliations

Construction of a prognostic risk model for acute myeloid leukemia based on exosomal genes and analysis of immune microenvironment characteristics

Min-Xiao Wang et al. Sci Rep. .

Abstract

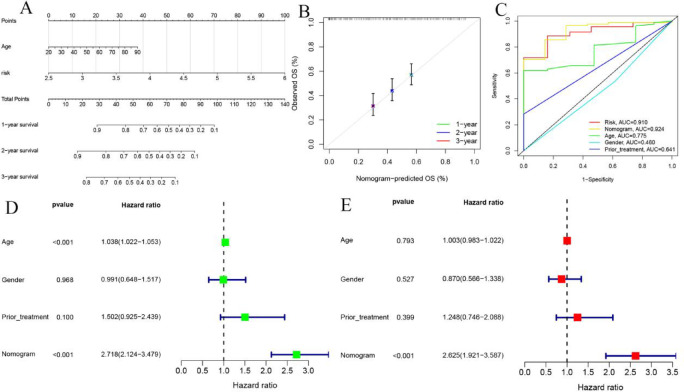
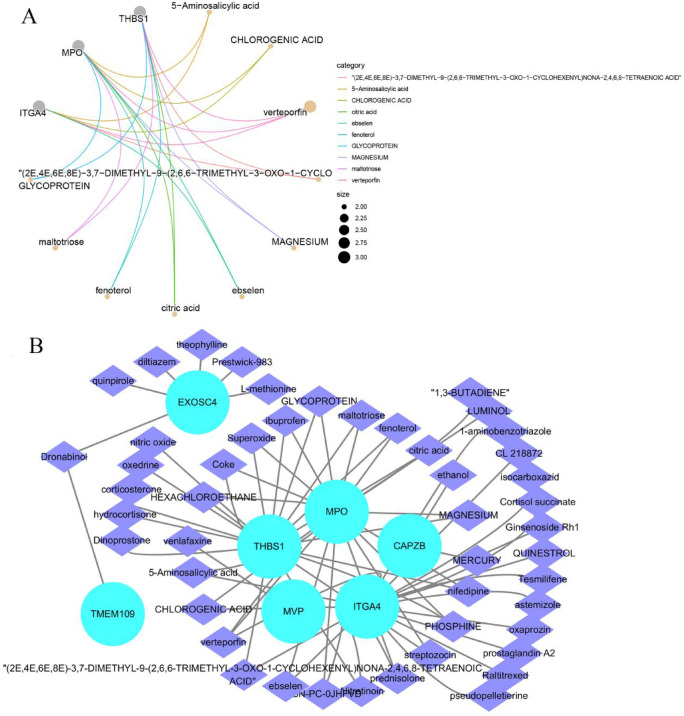
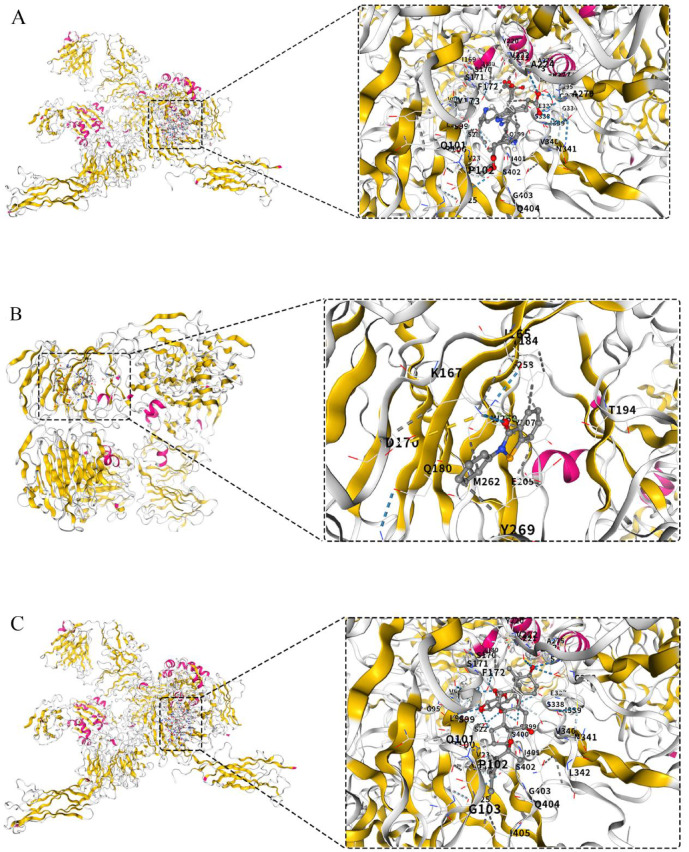
Acute myeloid leukemia (AML) exhibits significant heterogeneity in disease progression and therapeutic response, highlighting the urgent need for novel biomarkers to improve risk stratification and therapeutic targeting. In this study, we integrated multi-omics data from The Cancer Genome Atlas (TCGA, n = 151) and Genotype-Tissue Expression (GTEx, n = 337) cohorts to systematically analyze dynamic expression patterns of exosome-related genes in AML. Using univariate Cox regression and least absolute shrinkage and selection operator (LASSO) algorithms, we identified 13 exosome-associated genes (EXOSC4, TMEM109, THBS1, MYH9, HLA-DRA, CAPZB, ITGA4, MYL6, CYB5R1, PSMA2, MPO, NDST2, and CANX) and constructed a prognostic risk model. The model demonstrated superior predictive accuracy compared to traditional clinical parameters, with area under the curve (AUC) values of 0.819, 0.825, and 0.832 for 1-, 2-, and 3-year survival predictions in the training set, and 0.909 in the independent GEO validation cohort (GSE71014). Kaplan-Meier analysis revealed significantly shorter overall survival in the high-risk group (log-rank P < 0.001, hazard ratio = 0.22, 95% CI = 0.13-0.36). Immune microenvironment characterization using CIBERSORTx identified increased infiltration of regulatory T cells (Tregs, P < 0.01) in high-risk patients. Functional enrichment analysis revealed enrichment of PI3K-Akt signaling pathways and TP53 transcriptional networks in high-risk groups. Molecular docking studies confirmed strong binding affinity of verteporfin (ITGA4 inhibitor, docking score=-16.0 kcal/mol) and ebselen (MPO inhibitor) to their respective targets, suggesting potential therapeutic strategies to overcome chemotherapy resistance. This study establishes a robust 13-gene exosome-based prognostic signature for AML risk stratification and identifies novel immunomodulatory mechanisms mediated by exosome-driven Treg polarization.

Keywords: Acute myeloid leukemia; Exosome-related genes; Molecular docking; Prognostic risk model; Tumor microenvironment.


Conflict of interest statement

Declarations. Competing interests: The authors declare no competing interests. Ethics approval and consent to participate: This study is based entirely on publicly available datasets from the Gene Expression Omnibus (GEO) (accession: GSE71014) and multi-omics data from The Cancer Genome Atlas (TCGA) and Genotype-Tissue Expression (GTEx) projects. All data were anonymized and aggregated prior to analysis, in strict compliance with the Declaration of Helsinki. Consent for publication: All data used in this study are publicly accessible and anonymized. No individual patient data or identifiable information were collected, ensuring full compliance with privacy regulations.

Figures

Fig. 1
Fig. 1
Flow chart of research design and analysis.
Fig. 2
Fig. 2
(A) Venn Diagram Identifying Differential Genes Associated with Exosomes from AML. (B) Heatmap of exosome-related DEGs in AML and normal samples (red for high, blue for low).
Fig. 3
Fig. 3
Construction of the prognostic risk model. (A) forest plot displays 20 exosome-related genes identified through univariate Cox regression analysis as being associated with prognosis. (B, C) LASSO Cox regression analysis was employed to determine exosome-related genes closely associated with the prognosis of acute myeloid leukemia (AML). (D) Kaplan–Meier curve of the gene signature. (E) Principal component analysis (PCA) was conducted based on the exosome risk score to distinguish tumor samples from normal samples. The group marked in blue represents low-risk patients, while the group marked in red represents high-risk patients.
Fig. 4
Fig. 4
Validation of the prognostic risk signature. (A) Kaplan–Meier survival curves in the GEO cohort. (B) Receiver Operating Characteristic (ROC) curves for predicting 1-year, 3-year, and 5-year survival rates in the GEO cohort. (C) ROC curves comparing the prognostic performance of the risk score versus clinical characteristics. (D, E) Univariate and multivariate Cox regression analyses of clinical parameters in acute myeloid leukemia (AML) patients.
Fig. 5
Fig. 5
(A-C) Box plots illustrating the correlations between risk score and age, gender, as well as prior treatment.
Fig. 6
Fig. 6
Development and evaluation of a nomogram for patients with AML. (A) Nomogram for predicting the 1-year, 2-year, and 3-year overall survival rates in AML patients. (B) Calibration plot analysis to evaluate the predictive power of the nomogram. The x-axis is the survival rate predicted by the nomogram, and the y-axis is the actual survival rate. (C) Nomogram for predicting prognosis, risk score, and ROC curve for clinical characteristics. (D, E) Univariate and multivariate Cox regression analysis was performed to determine whether nomogram score was an independent predictor of AML patients. Green square: danger is higher than HR < 1; Red squares: HR > 1.
Fig. 7
Fig. 7
Box plot of the proportion of 22 immune cells in the high-risk group and low-risk group. * p < 0.05; ** p < 0.01; and *** p < 0.001.
Fig. 8
Fig. 8
(A, C) GO and KEGG pathway analyses of exosome-related core differentially expressed genes (DEGs) in the high-risk and low-risk groups of acute myeloid leukemia (AML), adapted from the KEGG database (https://www.kegg.jp/), Kanehisa Laboratories. Accessed 21 April 2025. © Kanehisa Laboratories. (B) Gene Ontology (GO) functional clustering distribution of the differentially expressed genes (DEGs). (D) Protein-protein interaction (PPI) network.
Fig. 9
Fig. 9
(A) Forest plot showing the screening of core exosome-related prognostic difference genes by univariate Cox regression analysis with P < 0.001. (B) Box plot of core exosome-related prognostic difference genes. (C) Correlation matrix of core exosome-related prognostic difference genes. (D) The regulatory relationship diagram of transcription factors and core exosome-related prognostic differential gene regulation, where yellow represents transcription factors and red represents differential genes.
Fig. 10
Fig. 10
(A) Drug Enrichment Analysis Network Diagram. Gray nodes represent genes or proteins, while orange nodes represent chemical substances. Edges of different colors indicate different types of interactions or associations between genes or proteins and chemical substances. The size of the nodes reflects their importance. (B) Drug Regulation Network Diagram. Genes are marked with purple diamond, and drugs are represented by blue circles.
Fig. 11
Fig. 11
(A) Schematic diagram of molecular docking between Verteporfin and ITGA4. (B) schematic diagram of molecular docking between ebselen and MPO. (C) schematic diagram of molecular docking between ginsenoside Rh1 and ITGA4.

References

    1. Wachter, F. & Pikman, Y. Pathophysiology of acute myeloid leukemia. Acta Haematol.147, 229–246. 10.1159/000536152 (2024). - PubMed
    1. Hackl, H., Astanina, K. & Wieser, R. Molecular and genetic alterations associated with therapy resistance and relapse of acute myeloid leukemia. J. Hematol. Oncol.10, 51. 10.1186/s13045-017-0416-0 (2017). - PMC - PubMed
    1. Venugopal, S. & Sekeres, M. A. Contemporary management of acute myeloid leukemia: a review. JAMA Oncol.10, 1417–1425. 10.1001/jamaoncol.2024.2662 (2024). - PubMed
    1. Thol, F. & Heuser, M. Treatment for relapsed/refractory acute myeloid leukemia. HemaSphere5, e572. 10.1097/hs9.0000000000000572 (2021). - PMC - PubMed
    1. Conway O’Brien, E., Prideaux, S. & Chevassut, T. The epigenetic landscape of acute myeloid leukemia. Adv. Hematol.2014, 103175. 10.1155/2014/103175 (2014). - PMC - PubMed

Substances