. 2025 Sep;7(9):1830-1850.
doi: 10.1038/s42255-025-01350-6. Epub 2025 Sep 1.

ATF6 activation alters colonic lipid metabolism causing tumour-associated microbial adaptation

Affiliations

ATF6 activation alters colonic lipid metabolism causing tumour-associated microbial adaptation

Olivia I Coleman et al. Nat Metab. 2025 Sep.

Abstract

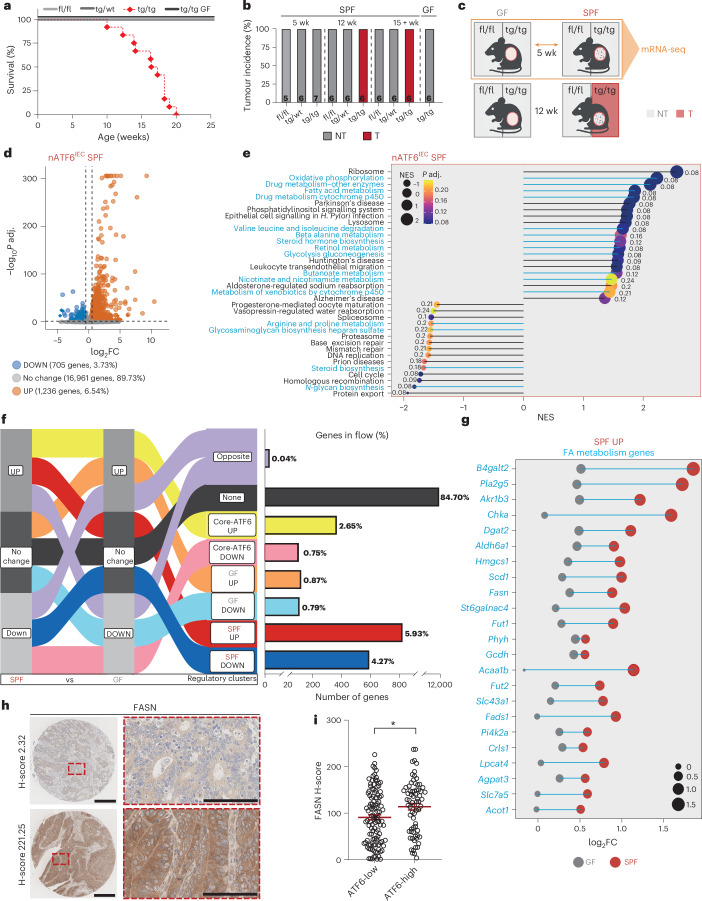
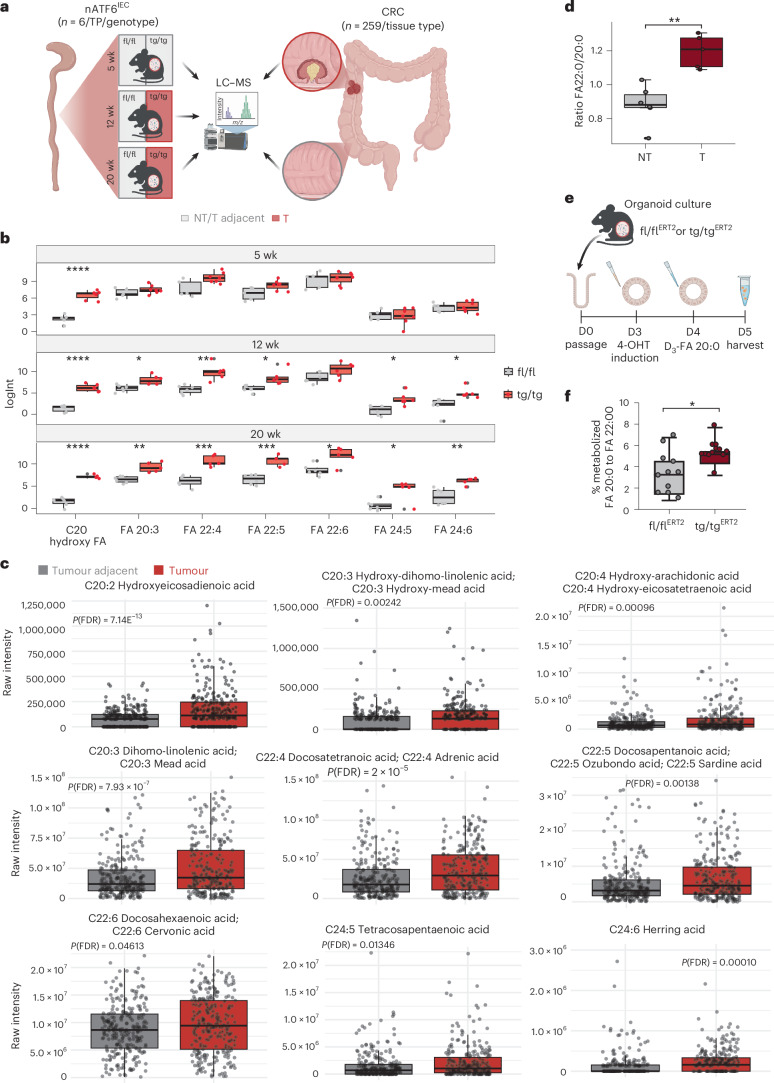
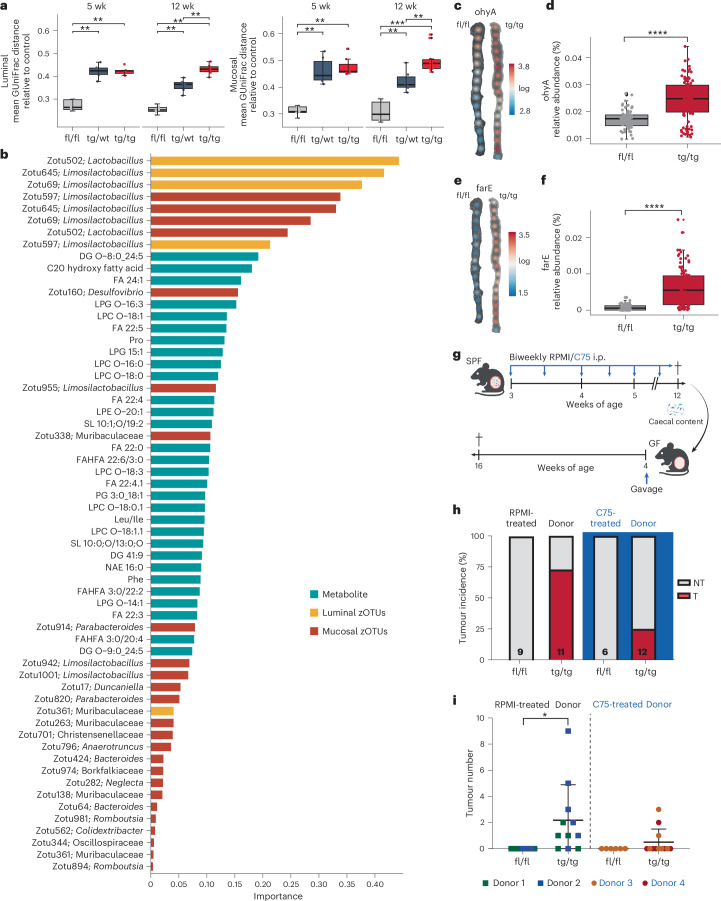
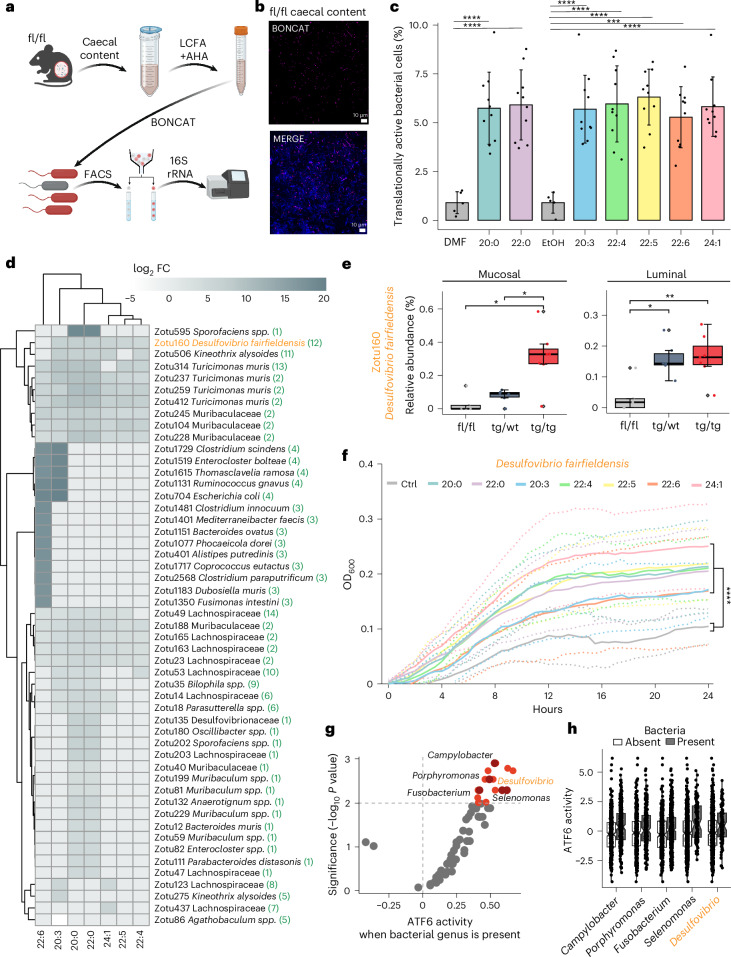
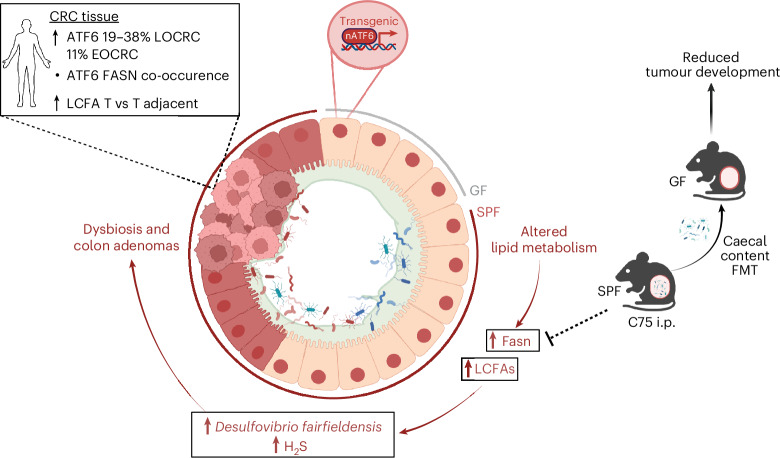
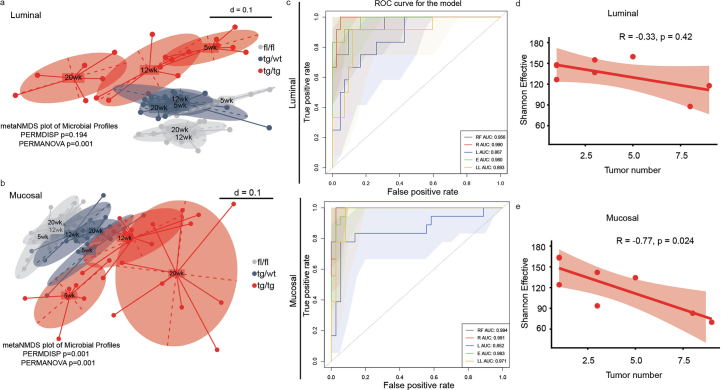
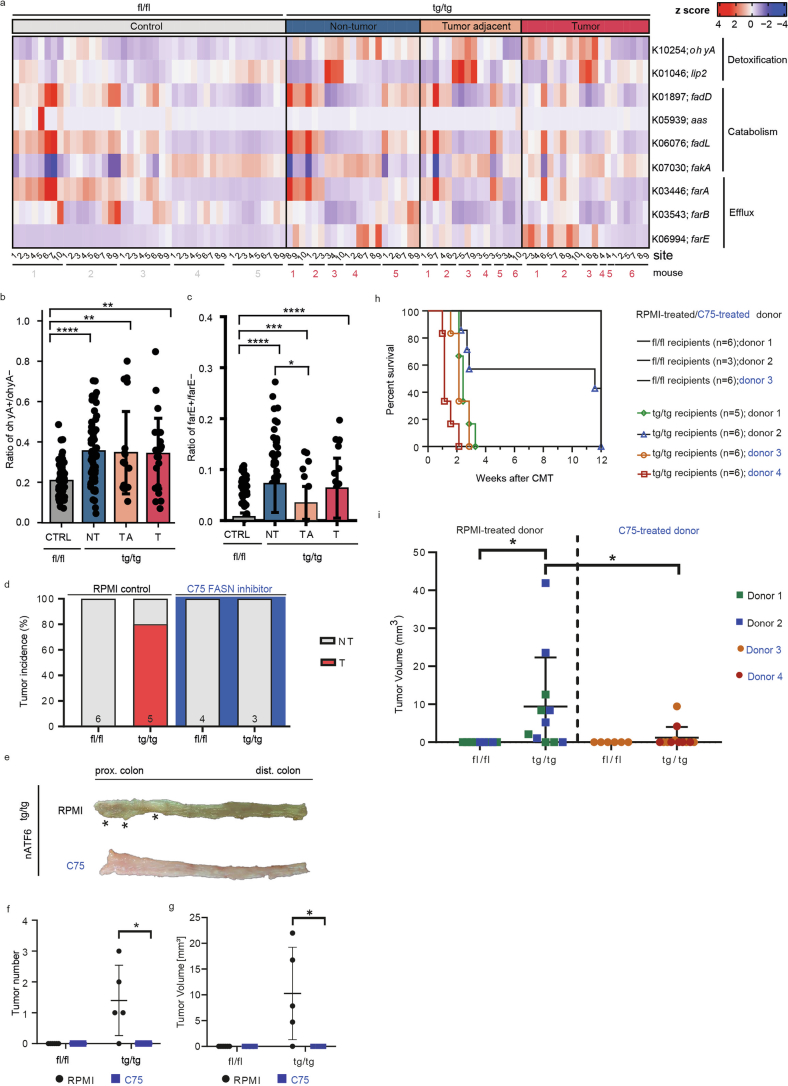
Endoplasmic reticulum unfolded protein responses contribute to cancer development, with activating transcription factor 6 (ATF6) involved in microbiota-dependent tumorigenesis. Here we show the clinical relevance of ATF6 in individuals with early-onset and late colorectal cancer, and link ATF6 signalling to changes in lipid metabolism and intestinal microbiota. Transcriptional analysis in intestinal epithelial cells of ATF6 transgenic mice (nATF6IEC) identifies bacteria-specific changes in cellular metabolism enriched for fatty acid biosynthesis. Untargeted metabolomics and isotype labelling confirm ATF6-related enrichment of long-chain fatty acids in colonic tissue of humans, mice and organoids. FASN inhibition and microbiota transfer in germ-free nATF6IEC mice confirm the causal involvement of ATF6-induced lipid alterations in tumorigenesis. The selective expansion of tumour-relevant microbial taxa, including Desulfovibrio fairfieldensis, is mechanistically linked to long-chain fatty acid exposure using bioorthogonal non-canonical amino acid tagging, and growth analysis of Desulfovibrio isolates. We postulate chronic ATF6 signalling to select for tumour-promoting microbiota by altering lipid metabolism.


Conflict of interest statement

Competing interests: The authors declare no competing interests.

Figures

Fig. 1
Fig. 1. High ATF6 expression defines a subset of individuals with CRC.
a, QuPath-quantified ATF6 H-score of NUC and CYT ATF6 expression in immunohistochemically stained CRC human tissue samples (cohort 1, n = 959 individuals). Significance was calculated using the two-tailed unpaired Wilcoxon test (P < 0.0001); indicated is the mean. Representative images of ATF6-high (n = 364 individuals) and ATF6-low (n = 595 individuals) staining in the tumour centre (TC) and the invasive front (IF). Percentage shows subpopulation of individuals with CRC in each ATF6-stained category (ATF6-low, light red; ATF6-high, dark red). Scale bars, 300 µm (overview) and 50 µm (zoom-in). b, Confusion matrix depicting the classification model of ATF6 H-scores quantified using QuPath (true labels) versus ATF6 H-scores predicted by the classification algorithm (predicted labels) for ATF6-high and ATF6-low individuals with CRC. c, Pie chart showing percentage of ATF6-high and ATF6-low individuals with CRC identified in CRC cohort 2 (n = 50 individuals) using the classification model. d, Regression model of ATF6 H-scores quantified using QuPath (true values) versus ATF6 H-scores predicted by the regression algorithm (predicted values) for NUC and CYT ATF6 expression. e, Pie chart showing percentage of ATF6-high and ATF6-low individuals with CRC identified in CRC cohort 2 (n = 50 individuals) using the regression model. f, QuPath-quantified ATF6 H-score of NUC and CYT ATF6 expression in immunohistochemically stained CRC human tissue samples (cohort 3, LOCRC, n = 256 individuals). Significance was calculated using the two-tailed unpaired Wilcoxon test (P < 0.0001); indicated is the mean. Representative images of ATF6-high (n = 49 individuals) and ATF6-low (n = 207 individuals) staining. Percentage shows subpopulation of individuals with CRC in each ATF6-stained category. Scale bars, 300 µm (overview) and 50 µm (zoom-in). g, QuPath-quantified ATF6 H-score of NUC and CYT ATF6 expression in immunohistochemically stained CRC human tissue samples (cohort 3, EOCRC, n = 55 individuals). Significance was calculated using the two-tailed unpaired Wilcoxon test (P = 0.0876), indicated is the mean. Representative images of ATF6-high (n = 6 individuals) and ATF6-low (n = 49 individuals) staining. Percentage shows subpopulation of individuals with CRC in each ATF6-stained category. Scale bars, 300 µm (overview), 50 µm (zoom-in). *P < 0.05, **P < 0.01, ***P < 0.001, ****P < 0.0001. Source data
Fig. 2
Fig. 2. ATF6 alters colonic FA metabolism in the presence of bacteria.
a, Survival curve showing the percentage survival of fl/fl, tg/wt, tg/tg SPF and tg/tg GF mice between 0 and 25 weeks of age (n = 6 fl/fl SPF mice, 7 tg/wt SPF mice, 12 tg/tg SPF mice and 10 GF tg/tg mice). b, Tumour incidence (percentage) of SPF fl/fl, tg/wt and tg/tg mice and GF tg/tg mice at the pre-tumour (5 week), tumour (12 week) and late-tumour (15+ week) time points. Grey represents no tumour, and red represents tumour. Number of mice is stated in each column. c, Schematic of non-tumour (NT) and tumour (T) phenotypes associated with GF and SPF fl/fl and tg/tg mice, highlighting the genotypes, age and colonization status used for the RNA-seq analyses (orange box and arrow; n = 6 mice per group). Created with BioRender.com. d, Volcano plot of detected genes in fl/fl versus tg/tg nATF6IEC mice showing the number and percentage of genes that are unchanged (no change), upregulated in tg/tg mice (UP) or downregulated in tg/tg mice (DOWN). Threshold: −0.5 > log2FC > 0.5, P adj. < 0.05. e, Lollipop graph of the top and bottom regulated KEGG pathways in tg/tg versus fl/fl nATF6IEC SPF mice (P adj. ≤ 0.25, −1 ≥ NES ≥ 1, with a minimum of 50% of genes detected in the pathway). Metabolic pathways are highlighted in blue. f, Alluvial plot depicting the flows used to define SiRCle clusters in a comparison between SPF and GF mice. Each data type (SPF and GF) has been labelled as a column, with one of three states (UP, no change, DOWN) defined for each column based on the results for differential analysis between fl/fl and tg/tg in that data type. Shown are the flows between each data type and state, which define the regulatory clusters (third column). The number and percentage of genes in the flow are depicted next to each regulatory cluster. g, Lollipop graph of the FA metabolism-related genes from the SPF UP cluster (blue) shown for GF (grey) and SPF (red) mice. h, Representative images of low H-score and high H-score FASN immunohistochemically stained in CRC human tissue samples (cohort 1, n = 181 individuals). Scale bars, 300 µm (overview), 50 µm (zoom-in). i, QuPath-quantified FASN H-score with individuals (cohort 1, n = 181 individuals) grouped into ATF6-low and ATF6-high (according to QuPath-quantified ATF6 H-score). Significance was calculated using the Student’s two-tailed unpaired t-test (P = 0.0105); indicated is the mean. *P < 0.05, **P < 0.01, ***P < 0.001, ****P < 0.0001. Source data
Fig. 3
Fig. 3. ATF6 drives FA elongation and LCFAs accumulate in mice and individuals with CRC.
a, Schematic depicting metabolomic analysis strategy in nATF6IEC mice and individuals with CRC (cohort 4). Created with BioRender.com. b, Box plots comparison of log-transformed FA intensities in caecal content, comparing fl/fl to tg/tg mice, stratified by time point (5 weeks n = 5 fl/fl mice, n = 7 tg/tg mice; 12 weeks n = 6 fl/fl mice, n = 5 tg/tg mice; 20 weeks n = 6 fl/fl mice, n = 5 tg/tg mice). Boxes depict the interquartile range (IQR), whiskers extend to furthest non-outlier values (no more than 1.5 times the IQR), and the centre lines indicate the median value. Only FA metabolites that were significant in mouse data and overlapped with CRC human data are shown. Statistical significance was calculated using pairwise t-tests and adjusted for multiple comparisons using the Benjamini–Hochberg procedure (week 5 C20 hydroxy FA P < 0.0001, week 12 C20 hydroxy FA P < 0.0001, FA 20:3 P = 0.003, FA 22:6 P = 0.02 FA 22:5 P = 0.0005, FA 22:4 P = 0.005, FA 24:6 P = 0.0005, FA 24:5 P = 0.01, week 20 C20 hydroxy FA P < 0.0001, FA 20:3 P = 0.01, FA 22:5 P = 0.01, FA 22:4 P = 0.005, FA 24:6 P = 0.01, FA 24:5 P = 0.03). c, Box plot comparison of FA intensities in tumour tissue and tumour-adjacent tissue of samples from cohort 4 (n = 259 individuals). The plot displays the intensity differences for nine FAs that showed significant abundance in tumour samples (left to right): hydroxyeicosadenoic acid (FA 20:2), hydroxy-dihomo-linolenic acid (FA 20:3), hydroxy-arachidonic acid (FA 20:4), dihomo-linoleic acid (FA 20:3), docosatetranoic acid (FA 22:4), docosapentanoic acid (FA 22:5), docosahexanoic acid (FA 22:6), tetracosapentanoic acid (FA 24:5) and herring acid (FA 24:6). Boxes depict the IQR, whiskers extend to the furthest non-outlier values (no more than 1.5 times the IQR), and the centre lines indicate the median value. Statistical significance was calculated using pairwise Wilcoxon tests and adjusted for multiple comparisons using the Benjamini–Hochberg procedure. A paired t-test was used to calculate P values (and corrected for false discovery rate (FDR)). Only FAs with P values (FDR corrected) < 0.05 are shown. d, Percentage of SAFAs in NT (n = 6 mice) and T (n = 5 mice) tissue after quantification of total FA using GC–MS. Box depicts IQR, whiskers extend to furthest non-outlier values (no more than 1.5 times the IQR), and the centre lines indicate the median value. Statistical analysis was performed using an unpaired Wilcoxon test (P = 0.0043). e, Scheme showing the treatment of intestinal organoids from nATF6 Vil-CreERT2 (fl/flERT2 and tg/tgERT2) mice cultured ex vivo (n = 11 fl/fl and n = 12 tg/tg biological replicates). Organoids were passaged at D0, ATF6 expression in all wells was induced at D3 with 500 nM (Z)-4-hydroxytamoxifen (4-OHT) and treated with D3-FA 20:0 at D4, before harvesting at D5 (see also Supplementary Fig. 1). Created with BioRender.com. f, Percentage of metabolized D3-FA 20:0 to D3-FA: 22:0 in organoids of tg/tgERT2, compared to fl/flERT2 controls using GC–MS. Significance was calculated using the Student’s two-tailed unpaired t-test (P = 0.0184). *P < 0.05, **P < 0.01, ***P < 0.001, ****P < 0.0001. Source data
Fig. 4
Fig. 4. ATF6-related lipid profiles are causally linked to tumour-associated microbiota.
a, Mean generalized UniFrac distance relative to control across fl/fl, tg/wt and tg/tg samples, at the pre-tumour time point (5 week) and at tumour onset (12 week) in luminal and mucosal communities. P values were calculated using pairwise Wilcoxon tests and adjusted for multiple comparisons using the Benjamini–Hochberg procedure (luminal: 5 weeks fl/fl versus tg/wt P = 0.0043, 5 weeks fl/fl versus tg/tg P = 0.0025, 12 weeks fl/fl versus tg/wt P = 0.0022, 12 weeks fl/fl versus tg/tg P = 0.0022, 12 weeks tg/wt versus tg/tg P = 0.0022; mucosal: 5 weeks fl/fl versus tg/wt P = 0.0043, 5 weeks fl/fl versus tg/tg P = 0.0025, 12 weeks fl/fl versus tg/wt P = 0.0022, 12 weeks fl/fl versus tg/tg P = 0.00016 12 weeks tg/wt versus tg/tg P = 0.0048). Boxes depict the IQR, whiskers extend to the furthest non-outlier values (no more than 1.5 times the IQR), and the centre lines indicate the median value (5 weeks n = 5 fl/fl mice, n = 6 tg/wt mice, n = 7 tg/tg mice; 12 weeks n = 6 fl/fl mice, n = 6 tg/wt mice, n = 6 tg/tg mice, n = 11 tissue samples). b, Loadings plots of omic features selected by the sPLS-DA model, discriminating tg/tg mice from other genotypes. Luminal zOTUs are shown in yellow, mucosal zOTUs in red and metabolites in blue. Features are sorted by importance (n = 18 tg/tg mice, n = 34 tg/wt and fl/fl mice). c, Spatial maps of log10-transformed predicted relative abundance of bacterial ohyA-positive zOTUs along the entire colon in fl/fl and tg/tg mice (n = 6 mice per group). d, Predicted relative abundance of bacterial ohyA in tg/tg and fl/fl mice (n = 6 mice per group, 15–17 tissue samples per mouse, P = 4.7 × 10−10). Boxes depict the IQR, whiskers extend to the furthest non-outlier values (no more than 1.5 times the IQR), and the centre lines indicate the median value. Statistical significance was calculated using pairwise t-tests and adjusted for multiple comparisons using the Benjamini–Hochberg procedure. e, Spatial maps of log10-transformed predicted relative abundance of bacterial FA efflux pump (farE)-positive zOTUs along the entire colon in fl/fl and tg/tg mice (n = 6 mice per group). f, Predicted relative abundance of FA efflux pump, farE in tg/tg and fl/fl mice (n = 6 mice per group, 15–17 tissue samples per mouse, P = <2.26 × 10−16). Boxes depict the IQR, whiskers extend to the furthest non-outlier values (no more than 1.5 times the IQR), and the centre lines indicate the median value. Statistical significance was calculated using pairwise t-tests and adjusted for multiple comparisons using the Benjamini–Hochberg procedure. g, Schematic showing the experimental design for in vivo C75 FASN inhibitor intervention and transfer experiment. SPF mice were i.p. injected with either the RPMI control or the C57 FASN inhibitor biweekly from the age of 3 weeks. After an intervention period of 9 weeks, mice were euthanized at 12 weeks of age. Arrows indicate i.p. injections. Created with BioRender.com. h, Tumour incidence (percentage) of GF fl/fl and tg/tg mice after gavage with donor material from either RPMI-treated mice (controls, n = 9 fl/fl mice and n = 11 tg/tg mice) or C75 FASN inhibitor-treated mice (n = 6 fl/fl mice and n = 12 tg/tg mice). i, Tumour number of GF fl/fl and tg/tg mice after gavage with donor material from either RPMI-treated mice (controls, n = n = 9 fl/fl mice and n = 11 tg/tg mice) or C75 FASN inhibitor-treated mice (n = 6 fl/fl mice and n = 12 tg/tg mice). Points are coloured by donor. Data are represented as the mean ± s.d. Statistical significance was calculated using an ordinary one-way ANOVA with Tukey’s multiple-comparison test (P = 0.0205). *P < 0.05, **P < 0.01, ***P < 0.001, ****P < 0.0001. Source data
Fig. 5
Fig. 5. LCFAs selectively activate the growth of tumour-related bacteria.
a, Schematic overview of BONCAT. Mouse caecal content was incubated in anaerobic conditions and stimulated with seven LCFAs, including arachidic acid (20:0), homo-γ-linolenic acid (20:3), docosanoic acid (22:0), docosatetraenoic acid (22:4), docosapentaenoic acid (22:5), docosahexaenoic acid (22:6) and nervonic acid (24:1) and along with the cellular activity marker l-azidohomoalanine (AHA). Translationally active bacterial cells were labelled by azide-alkyne click chemistry, sorted with FACS and sequenced by 16S rRNA gene amplicon sequencing. Created with BioRender.com. b, Representative confocal microscopic images of mouse caecal content stimulated with nervonic acid (24:1; n = 3 independent experiments and total of 5 biological replicates). Pink indicates active cells (BONCAT-Cy5); blue indicates all cells (DAPI); merge image. Scale bar, 10 µm. c, Percentage of translationally active bacteria after LCFA amendment. LCFAs were compared to their respective solvent control: 20:0 and 22:0 were compared to DMF, while 20:3, 22:4, 22:5, 22:6 and 24:1 were compared to ethanol (EtOh). P values were calculated by ANOVA and Tukey’s test for multiple comparisons (mean ± s.d.: 5.8% ± 1.6% for LCFAs in total; 0.9% ± 0.51% for the controls; ANOVA, P < 0.0001 for all comparisons, n = 80 total samples including seven LCFAs and two controls (DMF and EtOh), five biological replicates and two technical replicates). Error bars represent the s.d. of the mean. d, Heat map displaying log2-fold changes of significantly enriched or depleted zOTUs in the translationally active fraction compared to the unsorted group for each LCFA as calculated with the Wald test (P < 0.05, n = 160). All the zOTUs (51) listed in the heat map are significantly enriched or depleted. zOTUs were identified using the 16S-based ID tool of EzBioCloud. Numbers in parentheses correspond to the bar plots of Extended Data Fig. 10c where each barplot illustrates the shared and unique zOTUs between all LCFAs. e, Relative abundance of a D. fairfieldensis zOTUs, in luminal and mucosal communities comparing fl/fl, tg/wt and tg/tg mice (luminal n = 5 fl/fl mice, n = 6 tg/wt mice, n = 7 tg/tg mice; mucosal n = 5 fl/fl mice, n = 6 tg/wt mice, n = 7 tg/tg mice) at the 5-week time point. Boxes depict the IQR, whiskers extend to furthest non-outlier values (no more than 1.5 times the IQR), and the centre lines indicate the median. Statistical significance was calculated using pairwise t-tests and adjusted for multiple comparisons using the Benjamini–Hochberg procedure (mucosal: fl/fl versus tg/tg P = 0.014, tg/wt versus tg/tg P = 0.022; luminal fl/fl versus tg/wt P = 0.013, fl/fl versus tg/tg P = 0.0092). f, Growth curve of D. fairfieldensis in postgate medium, supplemented with different LCFAs. Each curve represents averaged values of n = 5 biological replicates in three technical replicates. LCFAs (20:0, 22:0, 20:3, 22:4, 22:5, 22:6 and 24:1) were added to postgate medium to a concentration of 10 µM each. The control (grey) contains only postgate medium with bacteria. All LCFA supplementations show significant increases in growth compared to the control (two-way ANOVA, Bonferroni test for multiple comparisons, P < 0,0001 for all comparisons, n = 392 total samples for each LCFA and control at all time points as the mean of five biological replicates). Error bars shown as dashed lines represent the s.d. of the mean. g, Plot of ATF6 activity in individuals with CRC (TCGA database, n = 610 CRC cases) when bacterial genus is present (x axis) and the significance (y axis). Marked in orange/red are those genera significantly associated with ATF6 activity, with red dots representing classical CRC-associated genera. h, Plot of ATF6 activity in individuals with CRC (TCGA database, n = 610 CRC cases) when bacteria are absent (white) or present (grey) for the CRC-associated genera marked red in g (P values: Campylobacter = 0.00123, Desulfovibrio = 0.00507, Porphyromonas = 0.00287, Fusobacterium = 0.00507, Selenomonas = 0.00507). *P < 0.05, **P < 0.01, ***P < 0.001, ****P < 0.0001. Source data
Fig. 6
Fig. 6. Chronic ATF6 signalling in the colonic epithelium alters lipid metabolism to select a tumour-promoting microbiota.
Biallelic expression of activated ATF6 (p50 nuclear fragment) in IECs (nATF6IEC) induces spontaneous colon tumours in SPF but not GF mice. Mechanistically, biallelic SPF nATF6IEC mice alter colonic lipid metabolism, including the upregulation of LCFAs and Fasn. Inhibition of FASN (C75 i.p.) prevents colon tumour formation in mice, and reduces the tumour-promoting potential of the intestinal microbiota (caecal content faecal microbiota transplantation (FMT)). Exposure of fl/fl control mouse microbiota to LCFAs ex vivo translationally activates tumour-associated bacteria, including D. fairfieldensis. Ex vivo exposure of D. fairfieldensis increases growth and H2S production. Humans with CRC show ATF6 upregulation, FASN co-occurrence and increased LCFAs in tumour (T) tissue. ATF6 activity links with CRC-associated microbiota in humans, including Desulfovibrio. nATF6, activated activating transcription factor 6; C75 i.p., intraperitoneal injection of the Fasn inhibitor C75. Created with BioRender.com.
Extended Data Fig. 1
Extended Data Fig. 1. ATF6 and GRP78 analyses in human CRC patients.
a, Representative images of ATF6 antibody staining in heart tissue (top, n = 1 patient) and the isotype control in CRC patient tissue (bottom, n = 170 patients). Scale bars: 300 µm overview, 50 µm zoom-in. b, Representative images of ATF6 antibody staining in the Colo800 cell lines, including plasmid-only controls (Ctrl, px459 for Atf6 KO and MLG for Atf6 TG), Atf6 KO and Atf6 TG. Scale bars: 100 µm. c, Nuclear (NUC) cutoff for the ATF6 H-score as determined using the online Cutoff Finder Web Application for Biomarker cutoff optimization, dividing patients into ATF6-high and ATF6-low. d, Cytoplasmic (CYT) cutoff for the ATF6 H-score as determined using the online Cutoff Finder Web Application for Biomarker cutoff optimization, dividing patients into ATF6-high and ATF6-low. e, Donut chart depicting the percentage of patients with all observed combinations of nuclear and cytoplasmic staining (NUC L/CYT L = low nuclear and low cytoplasmic staining, NUC L/CYT H = low nuclear and high cytoplasmic staining, NUC H/CYT L = high nuclear and low cytoplasmic staining, NUC H/CYT H = high nuclear and high cytoplasmic staining). f, QuPath quantified GRP78 H-score of ATF6-low and ATF6 high patients in immunohistochemically stained CRC patient tissue samples (cohort 1, n = 959), with group mean denoted by a horizontal red bar. Significance was calculated using the two-tailed unpaired Wilcoxon- test (p = 0.3524). g, Representative images of GRP78 antibody staining in CRC patient tissue samples (cohort 1, n = 959), stratified according to H-score and isotype control (cohort 1, n = 100). Scale bars: 300 µm overview, 50 µm zoom-in. h, Plot showing the classification model training accuracy, displaying the mean training and validation accuracy and their standard deviation. i, Plot showing the classification model training loss, displaying the mean training and validation loss and their standard deviation. A significant p-value < 0.05 is represented as an asterisk: *p < 0.05, **p < 0.01. ***p < 0.001, ****p < 0.0001. Source data
Extended Data Fig. 2
Extended Data Fig. 2. Gene expression and pathway analysis in response to ATF6 activation under GF and SPF conditions.
a, Volcano plot of detected genes in fl/fl (n = 6 mice) versus tg/tg (n = 6 mice) nATF6IEC mice showing the number and percentage of genes that are unchanged (No Change), upregulated in tg/tg mice (UP) or downregulated in tg/tg mice (DOWN). Threshold: −0.5 > log2FC > 0.5, p adj. <0.05. b, Lollipop graph of the top regulated KEGG pathways in tg/tg (n = 6 mice) versus fl/fl (n = 6 mice) nATF6IEC GF mice (p adj. <= 0.25, −1 = > NES > = 1, with a minimum of 50% of genes detected in the pathway). Metabolic pathways are highlighted in blue. NES, normalized enrichment score. c, Lollipop graph of log2 FC of UPR-related genes. ATF6-pathway related genes are highlighted in red. Colour represents enrichment (yellow = Acute SPF, blue = Chronic SPF, green = Chronic GF) and size, -log10 adjusted p-value (n = 6 mice per genotype) d, Volcano Plot of genes in the regulatory cluster CORE-ATF6 UP. Upset plot representing the number of genes detected for the respective transcription factors driving the cluster (n = 6 mice per genotype). e, Volcano Plot of genes in the regulatory cluster CORE-ATF6 DOWN. Upset plot representing the number of genes detected in the cluster-associated KEGG pathways (threshold: >5% of pathway genes detected, p adj. < 0.2). Upset plot representing the number of genes detected and the respective transcription factors driving the cluster (n = 6 mice per genotype). f, Volcano Plot of genes in the regulatory cluster SPF DOWN. Upset plot representing the number of genes detected in the cluster-associated KEGG pathways (threshold: >5% of pathway genes detected, p adj. < 0.2, n = 6 mice per genotype). g, Volcano Plot of genes in the regulatory cluster SPF UP. Genes related to fatty acid metabolism are highlighted in blue. Upset plot representing the number of genes detected in the cluster-associated KEGG pathways (threshold: >5% of pathway genes detected, p adj. < 0.2). Upset plot representing the number of genes detected and the respective transcription factors driving the cluster (n = 6 mice per genotype). h, Volcano plot of detected genes in fl/fl versus tg/tg following acute activation of ATF6 in nATF6 Vil-CreERT2 SPF mice showing the number and percentage of genes that are unchanged (No Change), upregulated in tg/tg mice (UP) or downregulated in tg/tg mice (DOWN). Threshold: −0.5 > log2FC > 0.5, p adj. <0.05. Genes related to fatty acid metabolism are highlighted in blue (n = 6 mice per genotype). A significant p-value < 0.05 is represented as an asterisk: *p < 0.05, **p < 0.01. ***p < 0.001, ****p < 0.0001. Source data
Extended Data Fig. 3
Extended Data Fig. 3. ATF6 and FASN co-occurrence in CRC patient cohorts.
a, Table showing the analysis of ATF6 amplifications/gain and FASN amplifications/gain in the pan-cancer and TCGA Datasets, indicating the log2 odds ratio (OR), p value and observed association/tendency. b, Kaplan-Meier analysis of disease-free survival shown for ATF6-low (blue) and ATF6-high (red) at different months after surgery in CRC cohort 1 (n = 959 patients, p = 0.284). c, Kaplan-Meier analysis of overall survival shown for ATF6-low (green) and ATF6-high (blue) at different months after surgery in CRC cohort 3 EOCRC patients. d, Kaplan-Meier analysis of overall survival shown for ATF6-low (green) and ATF6-high (blue) at different months after surgery in CRC cohort 3 LOCRC patients. e, Kaplan-Meier analysis of disease-free survival of patients in the Pan-Cancer Atlas database (n = 4129/10967 cases including approx. 600 CRC cases) with patients grouped into FASN + ATF6 unaltered, ATF6-only amp/gain or ATF6 + FASN amp/gain. f, Kaplan-Meier analysis of disease-free survival of patients in The Cancer Genome Atlas database (TCGA; n = 494/640 CRC cases) with patients grouped into FASN + ATF6 unaltered, ATF6-only amp/gain or ATF6 + FASN amp/gain. g, Kaplan-Meier analysis of overall survival of patients in the Pan-Cancer Atlas database (n = 8.345/10.967 cases including approx. 600 CRC cases) with patients grouped into FASN + ATF6 unaltered, ATF6-only amp/gain or ATF6 + FASN amp/gain. h, Kaplan-Meier analysis of overall survival of patients in The Cancer Genome Atlas database (TCGA; n = 543/640 CRC cases) with patients grouped into FASN + ATF6 unaltered, ATF6-only amp/gain or ATF6 + FASN amp/gain. Source data
Extended Data Fig. 4
Extended Data Fig. 4. Metabolite profiles in nATF6IEC mice.
a, PCA of metabolite profiles comparing fl/fl (circles), tg/wt (squares) and tg/tg (triangles) mice at 5wk, 12wk and 20wk. Grey indicates non-tumour (NT) and red tumour (T) (5wk n = 5 fl/fl mice, n = 6 tg/wt mice, n = 7 tg/tg mice; 12wk n = 6 fl/fl mice, n = 6 tg/wt mice, n = 6 tg/tg mice, 20wk n = 6 fl/fl mice, n = 6 tg/wt mice, n = 5 tg/tg mice). b, Volcano plot of differentially enriched metabolites between fl/fl and tg/tg mice across all time points (Log2 fold change threshold = 1.0, FDR threshold = 0.1). Significance was calculated using paired T-tests on log-transformed data (5wk n = 5 fl/fl mice, n = 6 tg/wt mice, n = 7 tg/tg mice; 12wk n = 6 fl/fl mice, n = 6 tg/wt mice, n = 6 tg/tg mice, 20wk n = 6 fl/fl mice, n = 6 tg/wt mice, n = 5 tg/tg mice). c, PCA of luminal lipid profiles between tumor-susceptible/tumor (T) and non-tumor (NT) mice at 5wk, 12wk and 20wk (5wk n = 5 fl/fl mice, n = 6 tg/wt mice, n = 7 tg/tg mice; 12wk n = 6 fl/fl mice, n = 6 tg/wt mice, n = 6 tg/tg mice, 20wk n = 6 fl/fl mice, n = 6 tg/wt mice, n = 5 tg/tg mice). d, Heatmap of scaled (z-score) differentially enriched metabolites, sorted by genotype and age. Rows are clustered using Ward’s method (5wk n = 5 fl/fl mice, n = 6 tg/wt mice, n = 7 tg/tg mice; 12wk n = 6 fl/fl mice, n = 6 tg/wt mice, n = 6 tg/tg mice, 20wk n = 6 fl/fl mice, n = 6 tg/wt mice, n = 5 tg/tg mice). Source data
Extended Data Fig. 5
Extended Data Fig. 5. Correlations of LCFAs with clinical prognosis.
a, Correlation plot, with 95% confidence intervals overlaid, of LCFA concentration and overall survival in CRC patients (n = 88) for the nine fatty acids that showed significant abundance in tumor samples: hydroxyeicosadenoic acid (FA 20:2), hydroxy-dihomo-linolenic acid (FA 20:3), hydroxy-arachidonic acid (FA 20:4), dihomo-linoleic acid (FA 20:3), docosatetranoic acid (FA 22:4), docosapentanoic acid (FA 22:5), docosahexanoic acid (FA 22:6), tetracosapentanoic acid (FA 24:5) and herring acid (FA 24:6). b, Correlation plot, with 95% confidence intervals overlaid, of LCFA concentration and progression-free survival in CRC patients (n = 77) for the nine fatty acids that showed significant abundance in tumor samples: hydroxyeicosadenoic acid (FA 20:2), hydroxy-dihomo-linolenic acid (FA 20:3), hydroxy-arachidonic acid (FA 20:4), dihomo-linoleic acid (FA 20:3), docosatetranoic acid (FA 22:4), docosapentanoic acid (FA 22:5), docosahexanoic acid (FA 22:6), tetracosapentanoic acid (FA 24:5) and herring acid (FA 24:6). Correlations were performed using pairwise Pearson correlation coefficients for all nine fatty acids. Significant correlations were defined as those with R > 0.6 and FDR-adjusted p < 0.05. Source data
Extended Data Fig. 6
Extended Data Fig. 6. Metabolite profiles in CRC patients and nATF6IEC mice.
a, Boxplot comparison of fatty acid intensities in tumor and tumor-adjacent tissue stratified for EOCRC (n = 99 patients) and LOCRC (n = 152 patients). Displayed are intensity differences for two fatty acids that show significant abundance in tumor tissue for EOCRC in addition to EOCRC. Boxes depict interquartile range (IQR), whiskers extend to furthest non-outlier values (no more than 1.5 x IQR), and the centre lines indicate the median value. Only fatty acids with p-values (FDR corrected) <0.05 are shown. Statistical significance was determined using a paired T-test. b, Mirror plots of MS/MS spectra for the annotation of fatty acids at 10, 20 and 40 eV. The plots compare the experimental MS/MS spectra (top, blue) with the standard compound spectra (bottom, red) for selected fatty acids. Correct annotation occurs when retention time, high-resolution mass, precursor and diagnostic fragment ions are similar between the analyte and the CRC-sample. c, Percentage of saturated fatty acids (SAFA) in NT (n = 6 mice) and T (n = 5 mice) tissue after quantification of total FA using GC-MS. Boxes depict interquartile range (IQR), whiskers extend to furthest non-outlier values (no more than 1.5 x IQR), and the centre lines indicate the median value. Statistical significance was calculated using pairwise Wilcoxon-tests and adjusted for multiple comparisons using the Benjamini-Hochberg procedure. d, Spearman’s rank correlation of percentage SAFA and tumor number, with 95% confidence intervals, after quantification of total FA using GC-MS. e, Representative images of intestinal organoids on day 1 (d1) and day 7 (d7) after culture, for the fl/fl and tg/tg genotype. Scale bars: 50 µm (n = 4 replicates, with n = 149 cysts for fl/fl d1, n = 170 cysts for tg/tg d1, n = 57 cysts for fl/fl d7 and n = 111 cysts for tg/tg d7). f, Quantification of organoid size as the sum of two dimensions in µm at d1 and d7 for the fl/fl and tg/tg genotype, with group mean denoted by a horizontal red bar (n = 4 replicates, with n = 149 cysts for fl/fl d1, n = 170 cysts for tg/tg d1, n = 57 cysts for fl/fl d7 and n = 111 cysts for tg/tg d7). Statistical significance was determined by a one-way ANOVA and Sidak’s test for multiple comparison (p < 0.0001). g, Quantification of the number of crypts per cyst at d7 for the fl/fl and the tg/tg genotype, with group mean denoted by a horizontal red bar (n = 4 replicates, with n = 149 cysts for fl/fl d1, n = 170 cysts for tg/tg d1, n = 57 cysts for fl/fl d7 and n = 111 cysts for tg/tg d7). Statistical significance was determined by a one-way ANOVA and Sidak’s test for multiple comparison. A significant p-value < 0.05 is represented as an asterisk: *p < 0.05, **p < 0.01. ***p < 0.001, ****p < 0.0001. Source data
Extended Data Fig. 7
Extended Data Fig. 7. Luminal and mucosal microbiota profiles in nATF6IEC mice.
a, Non-metric multidimensional scaling (NMDS) plot of Beta diversity profiles based on generalized UniFrac distance comparing genotypes (fl/fl, tg/wt and tg/tg) at each timepoint (5, 12 and 20-weeks) in luminal (PERMANOVA, 5wk n = 5 fl/fl mice, n = 6 tg/wt mice, n = 7 tg/tg mice; 12wk n = 6 fl/fl mice, n = 6 tg/wt mice, n = 6 tg/tg mice, 20wk n = 6 fl/fl mice, n = 6 tg/wt mice, n = 6 tg/tg mice) and b, mucosal data (PERMANOVA, 5wk n = 5 fl/fl mice, n = 6 tg/wt mice, n = 7 tg/tg mice; 12wk n = 6 fl/fl mice, n = 6 tg/wt mice, n = 11 tg/tg mice, 20wk n = 6 fl/fl mice, n = 6 tg/wt mice, n = 9 tg/tg mice). c, ROC curves comparing classification accuracy of Random Forest (RF), Ridge regression (RR), LASSO (L), Elastic-net (E) and L1-penalized regression (LL) models built on luminal and mucosal data, respectively. Solid line represents mean accuracy, with shaded areas representing range. Mucosal data was randomly subsampled (5wk n = 5 fl/fl mice, n = 4 tg/wt mice, n = 5 tg/tg mice; 12wk n = 6 fl/fl mice, n = 6 tg/wt mice, n = 10 tg/tg mice, 20wk n = 5 fl/fl mice, n = 5 tg/wt mice, n = 8 tg/tg mice) to match luminal (5wk n = 5 fl/fl mice, n = 6 tg/wt mice, n = 7 tg/tg mice; 12wk n = 6 fl/fl mice, n = 6 tg/wt mice, n = 6 tg/tg mice, 20wk n = 6 fl/fl mice, n = 6 tg/wt mice, n = 6 tg/tg mice) sample size. Models were trained using repeated 5-fold cross-validation (CV). d, Spearman’s rank correlation between Shannon Effective and tumor number in mucosal and e, luminal data, with 95% confidence intervals (luminal n = 7 tg/tg mice, mucosal n = 7 tg/tg mice). Source data
Extended Data Fig. 8
Extended Data Fig. 8. Multi-omics data integration of metabolite and microbial profiles.
a, Loadings plots of omic features selected by the sPLS-DA model, discriminating T from NT mice. Luminal zOTUs are shown in yellow, mucosal zOTUs in red and metabolites in blue. Features are sorted by importance (n = 41 NT mice, n = 11 T mice). b, Relevance network of highly correlated (Absolute correlation >0.65) metabolites and mucosal zOTUs for the genotype sPLS-DA model (n = 41 NT mice, n = 11 T mice). c, Relevance network of highly correlated (Absolute correlation >0.65) metabolites and luminal zOTUs for the genotype sPLS-DA model (n = 41 NT mice, n = 11 T mice). Source data
Extended Data Fig. 9
Extended Data Fig. 9. Bacterial lipid stress response and FASN inhibition.
a, Heatmap of bacterial FA-response genes predicted by PICRUSt2 for fl/fl controls and non-tumour (NT), tumour-adjacent (TA) and tumour (T) mucosal phenotypes of tg/tg mice. Spatial sites along the colon and biological replicates (mouse) are numerically labelled underneath. Only tumour-susceptible sites (sites 1–10) are shown (n = 6 mice per group and 15–17 colonic sites per mouse). b, Ratio of ohyA positive to ohyA negative taxa across various mucosal phenotypes in fl/fl and tg/tg mice (n = 6 mice per group and 15–17 colonic sites per mouse). P-values were calculated by one-way ANOVA and Tukey’s test for multiple comparisons. Data are represented as mean ± s.d. c, Ratio of farE positive to farE negative taxa across various mucosal phenotypes in fl/fl and tg/tg mice (n = 6 mice per group and 15–17 colonic sites per mouse). P-values were calculated by one-way ANOVA and Tukey’s test for multiple comparisons. Data are represented as mean ± s.d. d, Tumour incidence (percentage) of SPF fl/fl and tg/tg mice after termination of the intervention with either RPMI (controls) or C75 FASN inhibitor. Grey represents no tumor, red represents tumor. Each bar shows the number of mice for each genotype. e, Representative macroscopic images of the colon of the tg/tg genotype on RPMI or C75. Marked with circles and asterisks are tumors identified in the control group. f, Tumour number in SPF fl/fl and tg/tg mice after intervention with RPMI (control, n = 6 fl/fl mice and n = 5 tg/tg mice) or C75 (n = 4 fl/fl mice and n = 3 tg/tg mice). Statistical significance was determined using a two-way ANOVA. Data are represented as mean ± s.d. g, Tumour volume in SPF fl/fl and tg/tg mice after intervention with RPMI (control, n = 6 fl/fl mice and n = 5 tg/tg mice) or C75 (n = 4 fl/fl mice and n = 3 tg/tg mice). Statistical significance was determined using a two-way ANOVA. Data are represented as mean ± s.d. h, Survival curve showing percent survival of fl/fl and tg/tg GF mice colonised with either RPMI-treated or C75-treated microbiota between 0–12 weeks of age. i, Tumor volume (mm3) in GF fl/fl and tg/tg mice after gavage with donor material from either RPMI (controls, n = 9 fl/fl mice and n = 11 tg/tg mice) or C75 (n = 6 fl/fl mice and n = 12 tg/tg mice) treated mice. Points are colored by donor. Statistical significance was determined using a two-way ANOVA. Data are represented as mean ± s.d. Statistical significance was calculated using pairwise T-tests and adjusted for multiple comparisons using the Benjamini-Hochberg procedure (p = 0.0317). A significant p-value < 0.05 is represented as an asterisk: *p < 0.05, **p < 0.01. ***p < 0.001, ****p < 0.0001. Source data
Extended Data Fig. 10
Extended Data Fig. 10. Bacterial responses to LCFAs.
a, Alpha diversity richness showing significant difference between sorted and unsorted fraction (Wilcoxon test: p < 0.0001, n = 140 total samples including seven LCFAs sorted and unsorted fractions, 5 biological replicates and 2 technical replicates). Boxplot: boxplot medians (center lines), interquartile ranges (box ranges), whisker ranges. b, Beta-diversity MDS plot shows clustering of samples based on sorted and unsorted fractions (PERMANOVA, p = 0.001, n = 140 total samples including seven LCFAs sorted and unsorted fractions, 5 biological replicates and 2 technical replicates). Unsorted fraction= blue, sorted fraction= green. c, Venn diagram intersections shows 10 zOTUS shared between all LCFAs. 15 are shared between the saturated LCFAs (20:0 and 22:0), 9 are unique for 22:6 and 5 are shared between 22:6 and 20:3. The total size of each set is represented on the right barplot. The bottom plot represents all possible intersections, while their occurrence are shown in the top barplot. Each row corresponds to a set, and each column corresponds to one segment in a Venn diagram. A set is part of the intersection only when its cell is filled. Numbers in parenthesis on the top of each barplot represents which zOTUs belongs to each intersection. The corresponding zOTUS groups are highlighted in green in Fig. 5d. d, Beta-diversity MDS plot displayed the active fraction across the different LCFAs. No significant difference was found between LCFAs (PERMANOVA, p > 0.05, n = 70 total samples including seven LCFAs only sorted fraction, 5 biological replicates and 2 technical replicates). e, Relative abundance of zOTUs classified as Parasutterella (mucosal: fl/fl vs tg/tg p = 0.0017, fl/fl vs tg/tg p = 0.018, and luminal fl/fl vs tg/wt p = 0.008, fl/fl vs tg/tg p = 0.0057, tg/wt vs tg/tg p = 0.022) and Lachnospiraceae (luminal: fl/fl vs tg/tg p = 0.0025 s, in mucosal (top), mucosal (middle) and luminal (bottom) communities respectively, comparing fl/fl, tg/wt and tg/tg mice at the 5-week timepoint (n = 5 fl/fl, n = 6 tg/wt and n = 7 tg/tg mice). Boxes depict interquartile range (IQR), whiskers extend to furthest non-outlier values (no more than 1.5 x IQR), and the centre lines indicate the median value. Statistical significance was calculated using pairwise Wilcoxon-tests and adjusted for multiple comparisons using the Benjamini-Hochberg procedure. f, Desulfovibrio fairfieldensis growth in postgate medium, supplemented with different LCFAs, at 18 hours. Barplots represent averaged values of n = 5 biological replicates in three technical replicates. P-values were calculated by one-way ANOVA and Dunnet’s test for multiple comparisons (n = 40 total samples including seven LCFAs and controls, 5 biological replicates). Error bars represent standard deviation of the mean. g, Growth curve of Desulfovibrio piger in postgate medium, supplemented with different LCFAs. Each curve represents averaged values of n = 3 biological replicates in three technical replicates. Long-chain fatty acids (20:0, 22:0, 20:3, 22:4, 22:5, 22:6 and 24:1) were added to postgate medium to a concentration of 10 µM each. The control (gray) contains only postgate medium with bacteria. All LCFA supplementations show significant increase of growth compared to the control (two-way ANOVA, Bonferroni test for multiple comparisons, p < 0,0001 for all comparisons, n = 392 total samples for each LCFA and control at all timepoints as the mean of 3 biological replicates). Error bars shown as dotted line represent standard deviation of the mean. h, H2S concentration after 24-hour exposure of Desulfovibrio fairfieldensis in postgate medium to different LCFAs (10 µM). DMF and EtOH represent the respective solvent controls. Barplots represent averaged values of n = 4 biological replicates in three technical triplicates each. P-values were calculated by one-way ANOVA and Dunnet’s test for multiple comparison. Error bars represent standard deviation of the mean. i, Association of ATF6 activity with CRC-enriched genera (TCGA Database, n = 640 CRC cases) after correcting for MSI status, and correlation of the CRC-enriched genera (highlighted in red, 1–5) with ATF6 activity for MSS and MSI in the absence and presence of the respective bacteria. Boxes depict interquartile range (IQR), whiskers extend to furthest non-outlier values (no more than 1.5 x IQR), and the centre lines indicate the median value. A significant p-value < 0.05 is represented as an asterisk: *p < 0.05, **p < 0.01. ***p < 0.001, ****p < 0.0001. Source data

References

    1. Braakman, I. & Bulleid, N. J. Protein folding and modification in the mammalian endoplasmic reticulum. Annu. Rev. Biochem.80, 71–99 (2011). - PubMed
    1. Jacquemyn, J., Cascalho, A. & Goodchild, R. E. The ins and outs of endoplasmic reticulum-controlled lipid biosynthesis. EMBO Rep.18, 1905–1921 (2017). - PMC - PubMed
    1. Grootjans, J., Kaser, A., Kaufman, R. J. & Blumberg, R. S. The unfolded protein response in immunity and inflammation. Nat. Rev. Immunol.16, 469–484 (2016). - PMC - PubMed
    1. Rath, E., Moschetta, A. & Haller, D. Mitochondrial function - gatekeeper of intestinal epithelial cell homeostasis. Nat. Rev. Gastroenterol. Hepatol.15, 497–516 (2018). - PubMed
    1. Hetz, C., Zhang, K. Z. & Kaufman, R. J. Mechanisms, regulation and functions of the unfolded protein response. Nat. Rev. Mol. Cell Biol.21, 421–438 (2020). - PMC - PubMed