. 2025 Oct;22(10):2032-2041.
doi: 10.1038/s41592-025-02805-0. Epub 2025 Sep 1.

Functional phenotyping of genomic variants using joint multiomic single-cell DNA-RNA sequencing

Affiliations

Functional phenotyping of genomic variants using joint multiomic single-cell DNA-RNA sequencing

Dominik Lindenhofer et al. Nat Methods. 2025 Oct.

Abstract

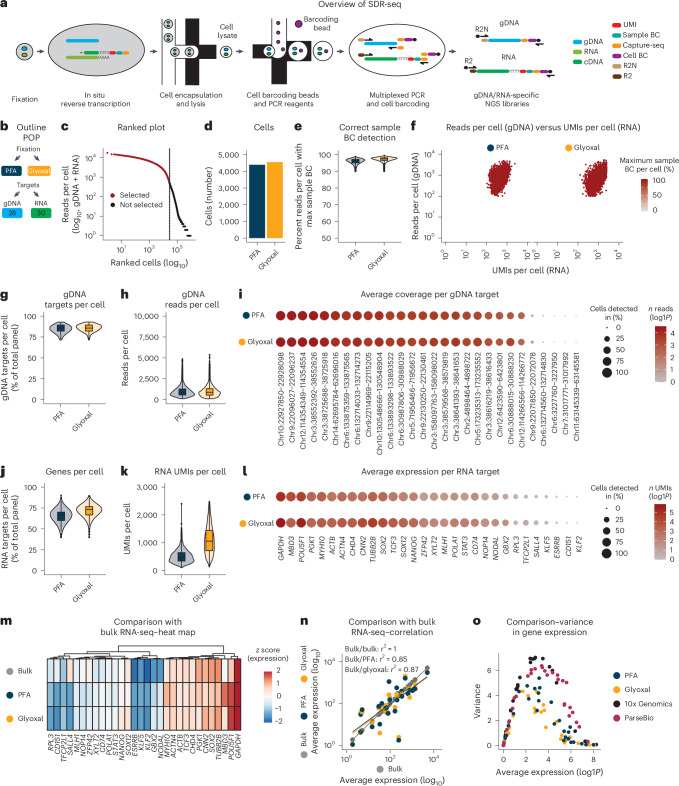
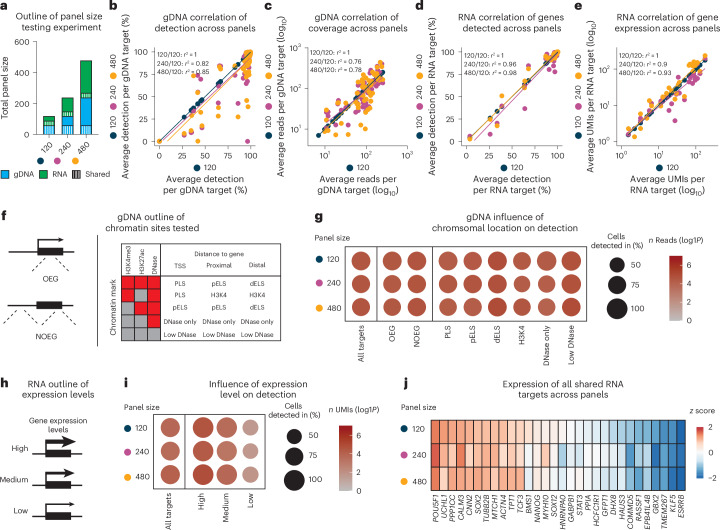
Genetic variants (both coding and noncoding) can impact gene function and expression, driving disease mechanisms such as cancer progression. The systematic study of endogenous genetic variants is hindered by inefficient precision editing tools, combined with technical limitations in confidently linking genotypes to gene expression at single-cell resolution. We developed single-cell DNA-RNA sequencing (SDR-seq) to simultaneously profile up to 480 genomic DNA loci and genes in thousands of single cells, enabling accurate determination of coding and noncoding variant zygosity alongside associated gene expression changes. Using SDR-seq, we associate coding and noncoding variants with distinct gene expression in human induced pluripotent stem cells. Furthermore, we demonstrate that in primary B cell lymphoma samples, cells with a higher mutational burden exhibit elevated B cell receptor signaling and tumorigenic gene expression. SDR-seq provides a powerful platform to dissect regulatory mechanisms encoded by genetic variants, advancing our understanding of gene expression regulation and its implications for disease.


Conflict of interest statement

Competing interests: L.M.S. is cofounder and shareholder of Sophia Genetics and founder and board member of LevitasBio and Recombia Biosciences. L.M.S. and D.L. have submitted a patent application on ‘High-throughput multiomic readout of RNA and genomic DNA within single cells’ (PCT/US2024/029950). D.F. is a cofounder and board member of Anthropocene Bio. The remaining authors declare no competing interests.

Figures

Fig. 1
Fig. 1. SDR-seq links gDNA variants and gene expression in single cells.
a, Overview of targeted SDR-seq. R2N (Nextera) or R2 (TruSeq) overhangs on reverse primers enable separate NGS library generation for gDNA and RNA. b, Outline of the POP experiment. The fixation conditions and number of gDNA/RNA targets are indicated. c, Knee plot of ranked cells by sequencing depth (gDNA + RNA). d, Number of cells found per fixation condition. e, Correct sample BC detection per cell. Read count for maximum sample BCs found was divided by the total amount of RNA reads per cell; n = 4,391 (PFA) and 4,553 (glyoxal) cells from one SDR-seq experiment. f, gDNA reads per cell versus RNA UMIs per cell per fixation condition. Color indicates the percentage of reads per cell with max sample BCs. g,h, Number of gDNA targets per cell (g) and gDNA reads per cell (h); n = 4,391 (PFA) and 4,553 (glyoxal) cells from one SDR-seq experiment. i, Individual gDNA targets are shown per fixation condition. Size indicates the percentage of cells detected in. Color indicates read coverage; chr, chromosome. j,k, Number of genes per cell (j) and RNA UMIs per cell (k); n = 4,391 (PFA) and 4,553 (glyoxal) cells from one SDR-seq experiment. l, Individual genes are shown per fixation condition. Size indicates the percentage of cells detected in. Color indicates UMI coverage. m, Comparison of expressed genes to bulk RNA-seq data; z score data are scaled by row. n, Pearson correlation of expressed genes to bulk RNA-seq data. o, Average expression and variance of genes assayed in the POP experiment using SDR-seq, 10x Genomics and ParseBio. Source data
Fig. 2
Fig. 2. SDR-seq scales to hundreds of targets simultaneously.
a, Outline of panel size testing experiments. gDNA and RNA targets are equal within panels; shared targets are indicated. b,c, Pearson correlation of detection (b) and coverage (c) of shared gDNA targets between panels. d,e, Pearson correlation of detection (d) and coverage (e) of shared genes between panels. f, Outline of chromatin sites tested. A combination of the chromatin marks detected and the relative distance to a gene define regulatory elements; PLS, promotor-like sequence; pELS, proximal enhancer-like sequence; dELS, distal enhancer-like sequence. g, Detection of different chromatin sites between panels. Size indicates the percentage of cells detected in. Color indicates read coverage. h, Outline of expression levels tested. i, Detection of genes with different expression levels between panels. Size indicates the percentage of cells detected in. Color indicates read coverage. j, Heat map of expression of all shared genes between panels; z score data are scaled by row. Source data
Fig. 3
Fig. 3. SDR-seq is sensitive to detect gene expression changes and link them to variants.
a, Outline of the CRISPRi screen. b, Volcano plot for the CRISPRi screen with different gRNA classes indicating fold change and P value calculated using MAST with a Benjamini–Hochberg correction for multiple testing. Significant hits (P < 0.05) are colored. For NTCs, all genes measured are shown. For other gRNA classes, only the intended target for each gRNA is shown. c, Outline of the PE screen. d, Volcano plot for the PE screen with different gRNA classes indicating fold change and P value calculated using MAST with a Benjamini–Hochberg correction for multiple testing. Significant hits (P < 0.05) are colored. Comparisons between the different alleles are shown as shapes; REF, reference allele; HET, heterozygous allele; ALT, alternative allele. e, Alleles and gene expression for SOX11, ATF4 and MYH10 STOP controls are shown; **P < 10−3 and ***P < 10−4 calculated using MAST with a Benjamini–Hochberg correction for multiple testing; n = 4,152 (SOX11: REF), 117 (SOX11: HET), 9 (SOX11: ALT), 4,916 (ATF4: REF), 53 (ATF4: HET), 4 (ATF4: ALT), 4,925 (MYH10: REF) and 18 cells (MYH10: HET) from one SDR-seq experiment; P = 3.05 × 10−4 (ATF4: REF–HET), 5.38 × 10−8 (ATF4: REF–ALT), 4.95 × 10−3 (ATF4: HET–ALT) and 7.90 × 10−10 (MYH10: REF–HET). f, Outline of the BE screen. g, Volcano plot for different gRNA classes indicating fold change and P value calculated using MAST with a Benjamini–Hochberg correction for multiple testing. Significant hits (P < 0.05) are colored. Comparisons between the different alleles are shown as shapes. h, Variants in the POU5F1 locus and their impact on gene expression are shown; UTR, untranslated region. The impact of each variant is color coded. REF, HET and ALT alleles are shown for each genotype. Fold change between the combination of variants is indicated in color (green), and P value (–log10) is indicated as size calculated using MAST with a Benjamini–Hochberg correction for multiple testing. Source data
Fig. 4
Fig. 4. SDR-seq to profile primary samples from individuals with B cell lymphoma.
a, Outline of the experiment. Primary samples and target panels are indicated. b, Uniform manifold approximation and projection (UMAP) highlighting the different samples clustered by either gene expression (RNA) or variants (gDNA). The numbers of cells for each sample are indicated as a bar graph. c, UMAP highlighting the maturation states clustered by either gene expression (RNA) or variants (gDNA). The numbers of cells within a maturation state are indicated as a bar graph (percentage of total); Mem, memory B cells. d, Variants detected in the experiment. Color indicates the percentage within B cells and non-B cells for each variant. Samples and HET/ALT alleles are indicated by color. Venn diagram showing the overlap of variants that occur with more than 5% frequency in each sample. e, Subset cells for DZ and LZ maturation states clustered by variants (gDNA) with clones indicated by color for each sample. The numbers of cells within DZ or LZ maturation states are indicated as a bar graph (percentage of total). f, Differentially abundant variants between DZ and LZ states (P < 0.05, χ2 test with a Benjamini–Hochberg correction). Summed counts of genes that the variants map to are shown in a bar graph. ΔDZ – LZ (percentage of the respective allele in DZ minus LZ) is shown in a heat map. Genes that the variants map to and patient of origin are indicated by color. g, Gene expression of the most frequently differentially expressed genes across samples in LZ and DZ states. Color indicates expression (z score, data are scaled by column), primary samples and maturation state. h, Gene Ontology (GO) term analysis of the most frequently differentially expressed genes. P values were computed using a Fisher’s exact test with the weight01 algorithm (topGO), correcting for GO hierarchy structure. cell., cellular; comp., compounds; DE, differentially expressed; proc., process; resp., response; trans., transduction. i, Genes involved in B cell receptor signaling in cells with high (top 20%) and low (bottom 20%) variant burden in DZ and LZ states. Color indicates expression (z score, data are scaled by column), primary samples, genes, maturation state and variant burden. Source data
Extended Data Fig. 1
Extended Data Fig. 1. Quality controls and comparison of PFA and glyoxal fixation conditions.
a, Overview of targeted scDNA-scRNA-seq (SDR-seq) method for proof-of-principle (POP) experiment. R2N (Nextera) reverse primer overhangs were used for both gDNA and RNA. b, Quality control plots to remove doublets showing RNA reads per cell for each set of sample barcodes used to discriminate PFA and glyoxal fixation conditions. Doublets are indicated in grey. Cell numbers are indicated on the right. cf, Quality control plots before (c, d) and after (e, f) filtering for low quality cells. Color indicates fraction of detected gDNA or RNA targets respectively. g, h, Coverage and detection of each gDNA (g) or RNA (h) target. Dashed line indicates 80% detection. i, j, Comparison of coverage and detection between PFA and glyoxal for each gDNA (i) and RNA (j) target. LFC, log fold change (log2). Source data
Extended Data Fig. 2
Extended Data Fig. 2. UMAPs and clustering of POP data.
a, UMAP clustering of POP SDR-seq data based on gene expression. b, Color coding of UMAP by fixation condition. c, UMAP plots of ubiquitously expressed genes GAPDH, POU5F1 and SOX2. Color indicates normalized expression (log1p). d, UMAP plots of cluster-specifically expressed genes KLF5, SALL4 and ESRRB. Color indicates normalized expression (log1p). e, Gene expression correlation (Pearson) between 100 subsampled cells comparing them individually against each other for SDR-seq, 10x Genomics and ParseBio. n = 4950 comparisons for SDR-seq, 10x Genomics and ParseBio. f, Outline of cell mixing experiment using either human (WTC-11) or mouse (NIH-3T3) cells. During in situ RT cells were either used in individual wells or mixed together. g, h, Number of cells found for each species per in situ RT condition before (g) and after (h) doublet removal using sample BC information during analysis. i, j, Cross contamination of gDNA (i) and RNA (j) molecules between species for each in situ RT condition. n = 3865 cells (WTC-11), 4308 cells (NIH-3T3) and 7930 cells (Mix) from 1 independent SDR-seq experiment. kn, Quality control plots to show either gDNA reads/cell (k, l) or RNA UMIs/cell (m, n) for each in situ RT condition before and after doublet removal and ambient RNA/UMI removal using sample BC information. Source data
Extended Data Fig. 3
Extended Data Fig. 3. SDR-seq with separate library generation for RNA and gDNA targets.
ad, Subsampled reads/cell for all gDNA (a) or RNA (c) targets or shared gDNA (b) or RNA (d) targets (d). n = 9680 cells (120 panel), 6610 cells (240 panel) and 804 cells (480 panel) from 1 independent SDR-seq experiment for each panel size testing. e, Overview of SDR-seq with separate library generation for RNA and gDNA. Distinct R2 (RNA) or R2N (gDNA) overhangs for each library. Sequencing ready libraries can be generated using specific library primers binding to R2 or R2N, respectively. f, Specificity of gDNA and RNA NGS libraries. Data from gDNA or RNA libraries was mapped to either gDNA or RNA references. Data points represent means ± SEM. n = 3 independent SDR-seq experiments. Source data
Extended Data Fig. 4
Extended Data Fig. 4. Metrics for target detection and coverage across differently sized target panels.
a, Quality metrics of panel size experiment. Color indicates fraction of gDNA targets/cell recovered. b, gDNA coverage and detection for all targets across panels tested. Dashed line indicates 80% detection. c, gDNA target detection per cell for all targets across panels tested. n = 9680 cells (120 panel), 6610 cells (240 panel) and 804 cells (480 panel) from 1 independent SDR-seq experiment for each panel size testing. d, gDNA coverage and detection for shared targets across panels tested. Dashed line indicates 80% detection. e, gDNA target detection per cell for shared targets across panels tested. n = 9680 cells (120 panel), 6610 cells (240 panel) and 804 cells (480 panel) from 1 independent SDR-seq experiment for each panel size testing. f, Quality metrics of panel size experiment. Color indicates fraction of RNA targets/cell recovered. g, RNA coverage and detection for all targets across panels tested. Dashed line indicates 80% detection. h, RNA target detection per cell for all targets across panels tested. n = 9680 cells (120 panel), 6610 cells (240 panel) and 804 cells (480 panel) from 1 independent SDR-seq experiment for each panel size testing. i, RNA coverage and detection for shared targets across panels tested. Dashed line indicates 80% detection. j, RNA target detection per cell for shared targets across panels tested. n = 9680 cells (120 panel), 6610 cells (240 panel) and 804 cells (480 panel) from 1 independent SDR-seq experiment for each panel size testing. Source data
Extended Data Fig. 5
Extended Data Fig. 5. Comparison of target detection and coverage across differently sized target panels.
a, b, Comparison of coverage and detection for shared targets across panels tested for each gDNA (a) and RNA (b) target. LFC, log fold change (log2). c, Coverage and detection for shared targets across panels. Dashed line indicates 80% of cells detected in, which is the threshold used for categorizing highly covered amplicons that were used to determine allelic dropout (ADO). d, Percentage of correctly called heterozygous alleles across panels on shared targets. n = 58 variants from 1 independent SDR-seq experiment for each panel size testing. e, Influence of detection and gDNA coverage on correctly called heterozygous alleles. f, g, Normalized frequency of miscalled variants across panels on shared targets for conversions (f) or deletions/insertions (g). h, Example gDNA target amplicon with indicated frequencies of variants. Dashed lines indicate primer binding sites. i, Density of variant allele frequencies for heterozygous variants and noise. Source data
Extended Data Fig. 6
Extended Data Fig. 6. Quality metrics for CRISPRi screen and functional testing of PE iPSCs.
a, Overview of gRNA assignment for CRISPRi screen. b, Coverage for each gRNA in CRISPRi screen. Data points represent means ± SEM. n = individual gRNAs from 1 SDR-seq experiment. c, Relative distance of gRNA binding site to transcription start site (TSS). Positive values are after TSS (within transcript), negative values before transcript. Size indicates P-value calculated using MAST with Benjamini-Hochberg correction for multiple testing. Significant hits (P-value < 0.05) are colored. d, Outline of testing for PE iPSCs. Editing can be measured by repairing a non-functional EGFP that was integrated via a lentivirus. e, Flow cytometry indicating editing in PE iPSCs. Source data
Extended Data Fig. 7
Extended Data Fig. 7. Editing efficiency and genotyping in PE screen.
a, Editing efficiency in PE screen. CRISPRi is indicated as a control. Data points represent means ± SEM. n = 19 variants from 1 CRISPRi SDR-seq experiment and 1 PEmax/PEmax-MLHdn1 SDR-seq experiment. b, Editing efficiency for each locus that was assessed. Loci that had somatic alleles in the PE iPCSs that were either HET or ALT are not shown. Color indicates PE cell lines. Data points represent means ± SEM. n = 19 variants from 1 PEmax/PEmax-MLHdn1 SDR-seq experiment. ce, Called genotypes and genotype quality vs. variant allele frequency (VAF) for SOX11 (c), ATF4 (d) and MYH10 (e). Source data
Extended Data Fig. 8
Extended Data Fig. 8. POU5F1 locus in BE screen.
a, Intended edit to be introduced by base editing gRNA is shown at the POU5F1 locus and its impact on gene expression. ***P < 10−4, MAST with Benjamini-Hochberg correction. n = 46 cells (POU5F1:REF), 4172 cells (POU5F1:HET) and 1163 cells (POU5F1:ALT) from 1 SDR-seq experiment. P-value = 5.78x10⁻²⁰ (POU5F1: HET-ALT), b, All measured variants in combination along the measured gDNA site shown for POU5F1 with their impact on gene expression. Number of cells are indicated on top. c, Comparison of variants at POU5F1 locus identified with SDR-seq to bulk amplicon sequencing. Source data
Extended Data Fig. 9
Extended Data Fig. 9. Assignment of maturation states in B-cell lymphoma patient samples, comparison of variant abundance and analysis of differentially expressed genes in DZ and LZ states in cells with and without variants.
a, Prediction scores of cell types assignment using a reference dataset,. Each cell is assigned a state, higher score indicates better assignment of this cell to the respective state. b, UMAP of cells belonging to the geminal center (GC) maturation states including DZ and LZ. Color indicates the state. c, Ig light chain restriction. Color coded are either kappa or lamda Ig light chains. d, Comparison of variant allele frequencies (VAF) of variants found in bulk or in SDR-seq in either B-cells or non-B-cells. Color indicates VAF. e, Summed counts for differentially expressed (DE) genes between variant containing and non-containing cells within both DZ and LZ for most frequent variants for each patient. Source data

References

    1. Landrum, M. J. et al. ClinVar: public archive of relationships among sequence variation and human phenotype. Nucleic Acids Res.42, D980–D985 (2014). - PMC - PubMed
    1. Buniello, A. et al. The NHGRI-EBI GWAS catalog of published genome-wide association studies, targeted arrays and summary statistics 2019. Nucleic Acids Res.47, D1005–D1012 (2019). - PMC - PubMed
    1. Eichler, E. E. Genetic variation, comparative genomics, and the diagnosis of disease. N. Engl. J. Med.381, 64–74 (2019). - PMC - PubMed
    1. Schraivogel, D. et al. Targeted Perturb-seq enables genome-scale genetic screens in single cells. Nat. Methods17, 629–635 (2020). - PMC - PubMed
    1. Esk, C. et al. A human tissue screen identifies a regulator of ER secretion as a brain-size determinant. Science370, 935–941 (2020). - PubMed

LinkOut - more resources