

Comparative mitogenomics reveals evolutionary drivers of Strongyloidea nematodes dwelling in gastrointestinal tract
- PMID: 40890580
- PMCID: PMC12403925
- DOI: 10.1186/s12864-025-11980-5
Comparative mitogenomics reveals evolutionary drivers of Strongyloidea nematodes dwelling in gastrointestinal tract
Abstract
Background: The nematode superfamily Strongyloidea represents a prevalent group of gastrointestinal parasites in ruminants and livestock, posing substantial veterinary and economic burdens worldwide. Here we present the first mitochondrial genomic investigation for reconstructing Strongyloidea phylogeny and investigating niche-specific selection dynamics across gastrointestinal habitats (abomasum, small intestine, and large intestine). This study presents a preliminary exploration of the evolutionary adaptations of these agriculturally relevant parasites through comprehensive mitogenomic analysis.
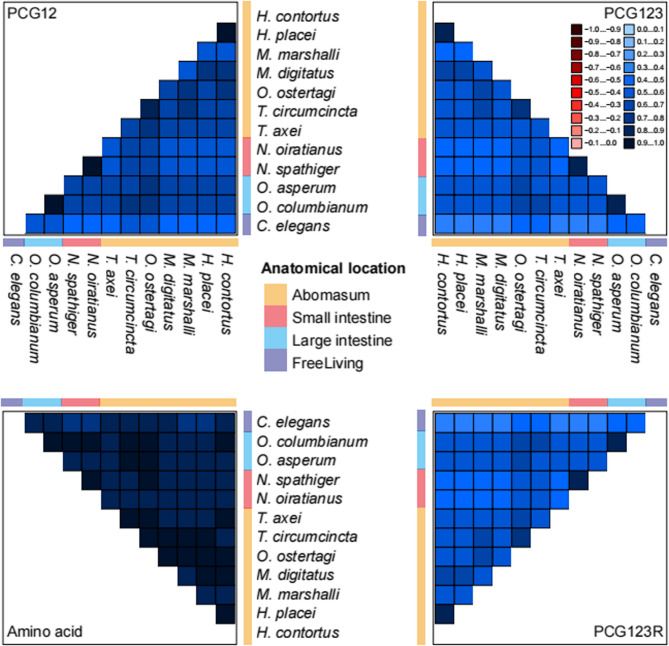
Results: Phylogenomic reconstruction revealed strong anatomical clustering with high nodal support. Comparative synteny analyses revealed conserved mitogenome architectures across Strongyloidea species, characterized by pronounced AT-richness. Codon usage patterns showed high consistency in Strongyloide (94% A/U-ending preferred codons), with ENC-plot and neutrality analyses confirming natural selection as the dominant driver. Pervasive purifying selection was observed, but abomasal species showed higher ω values than intestinal counterparts, particularly in ND4. In addition, positive selection was detected exclusively in CYTB within the small intestinal lineage. RELAX analysis identified differential selection signals among the three branches, with significant relaxation observed in ND5 and ND6 genes in the abomasal species. Amino acid polymorphism analyses revealed higher sequence variation in ND genes compared to the highly conserved COX genes.
Conclusions: Our findings demonstrated niche-associated evolutionary trajectories between abomasal and intestinal Strongyloidea branches, reflected in both phylogenetic patterns and molecular evolution rates. The mitogenomic framework established here provided a foundation for future studies integrating expanded datasets, genomic data, and microenvironmental parameters to elucidate precise niche adaptation mechanisms in these economically important parasites.
Keywords: Abomasum; Large intestine; Mitochondrial genome; Phylogenetic relationships; Selection pressure; Small intestine; Strongyloidea.
© 2025. The Author(s).
Conflict of interest statement
Declarations. Ethics approval and consent to participate: Not applicable. Consent for publication: Not applicable. Competing interests: The authors declare no competing interests.
Figures


References
-
- dos Santos LL, Prosdocimi F, Lima NCB, da Costa IR, Cardoso DC, Drummond MG, Brasil BSAF, Bastianetto E, de Oliveira DAA. Comparative genomics and phylogenomics of Trichostrongyloidea mitochondria reveal insights for molecular diagnosis and evolutionary biology of nematode worms. Gene Rep. 2017;9:65–73.
-
- Durette-Desset MC, Hugot JP, Darlu P, Chabaud AG. A cladistic analysis of the Trichostrongyloidea (Nematoda). Int J Parasitol. 1999;29(7):1065–86. - PubMed
-
- Mitreva M, Blaxter ML, Bird DM, McCarter JP. Comparative genomics of nematodes. Trends Genet. 2005;21(10):573–81. - PubMed
-
- Koutsovoulos GD, Marques E, Arguel MJ, Duret L, Machado ACZ, Carneiro RMDG, Kozlowski DK, Bailly‐Bechet M, Castagnone‐Sereno P, Albuquerque EVS. Population genomics supports clonal reproduction and multiple independent gains and losses of parasitic abilities in the most devastating nematode pest. Evol Appl. 2020;13(2):442–57. - PMC - PubMed
Publication types
MeSH terms
Grants and funding
- 32260892 and 32160844/National Natural Science Foundation of China
- 2022MS03065/Natural Science Foundation of Inner Mongolia Autonomous Region
- 2022LJRC0009/Science and Technology Leading Talent Team in Inner Mongolia Autonomous Region
- 2021ZD0023/Key Laboratory of Reproductive Regulation and Breeding of Grassland Livestock
LinkOut - more resources
Full Text Sources
