. 2025 Sep 2;23(1):600.
doi: 10.1186/s12951-025-03630-5.

Circadian disruption and ROS-NLRP3 signaling mediate sleep deprivation-enhanced silica nanoparticle toxicity in lacrimal glands

Affiliations

Circadian disruption and ROS-NLRP3 signaling mediate sleep deprivation-enhanced silica nanoparticle toxicity in lacrimal glands

Wenxiao Zhang et al. J Nanobiotechnology. .

Abstract

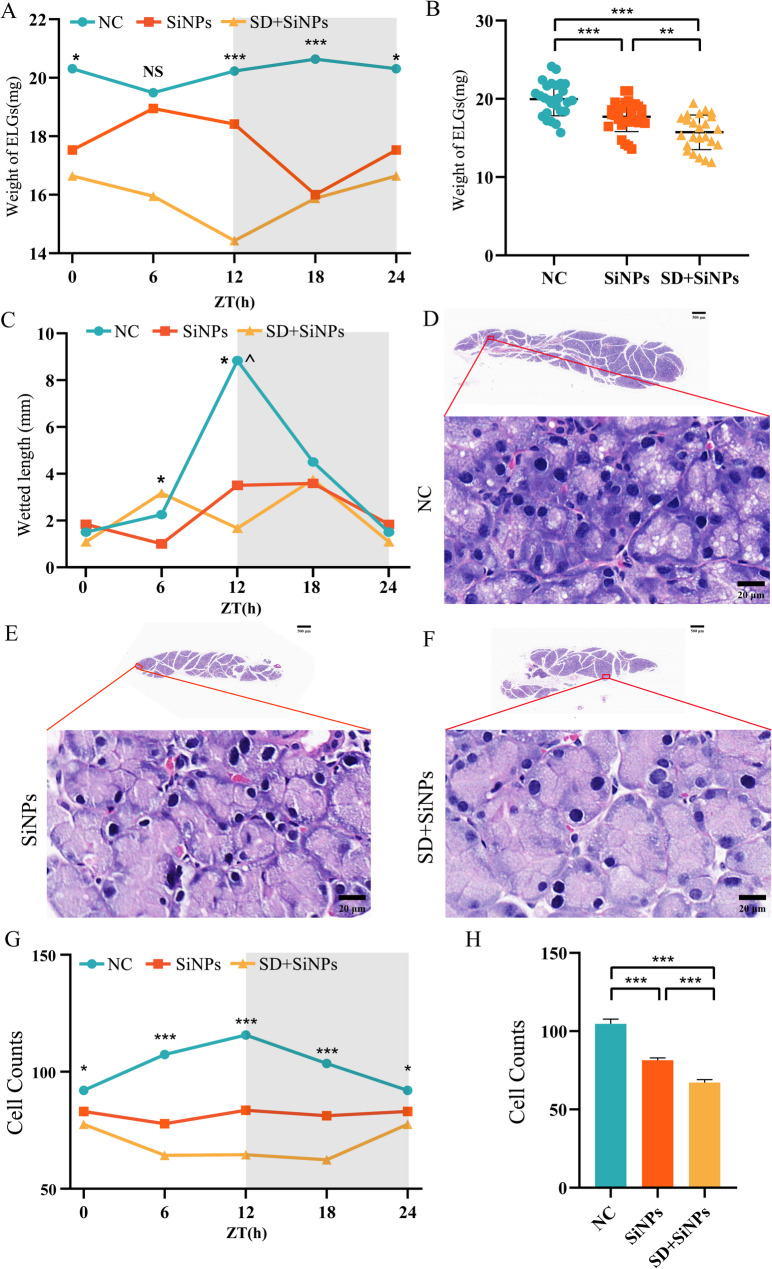
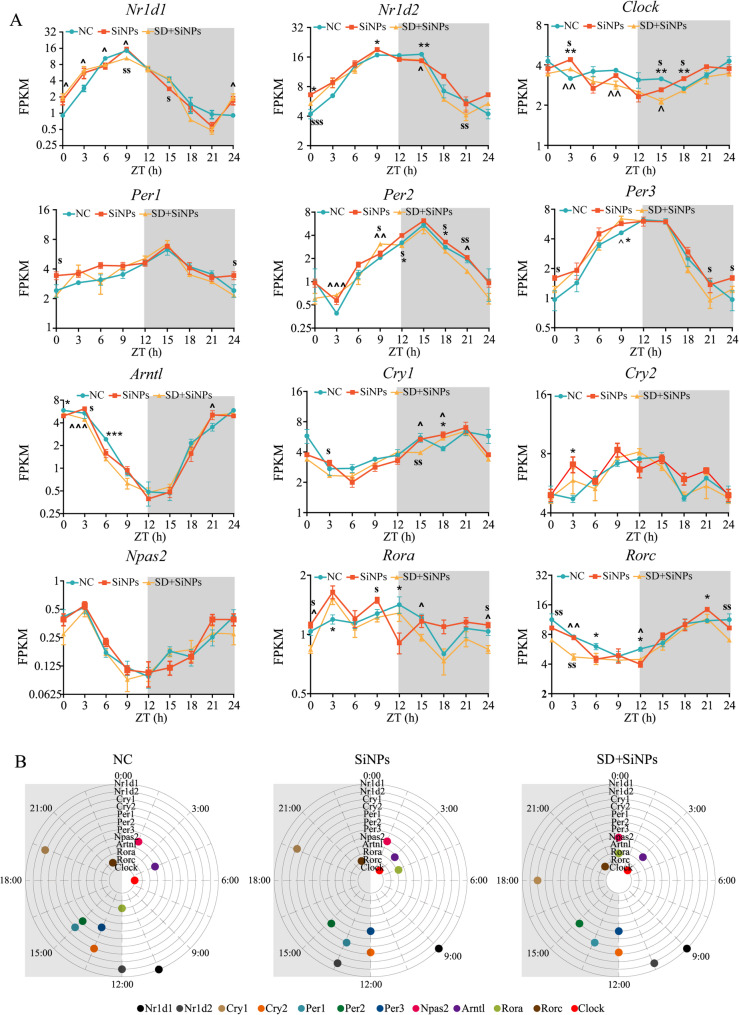
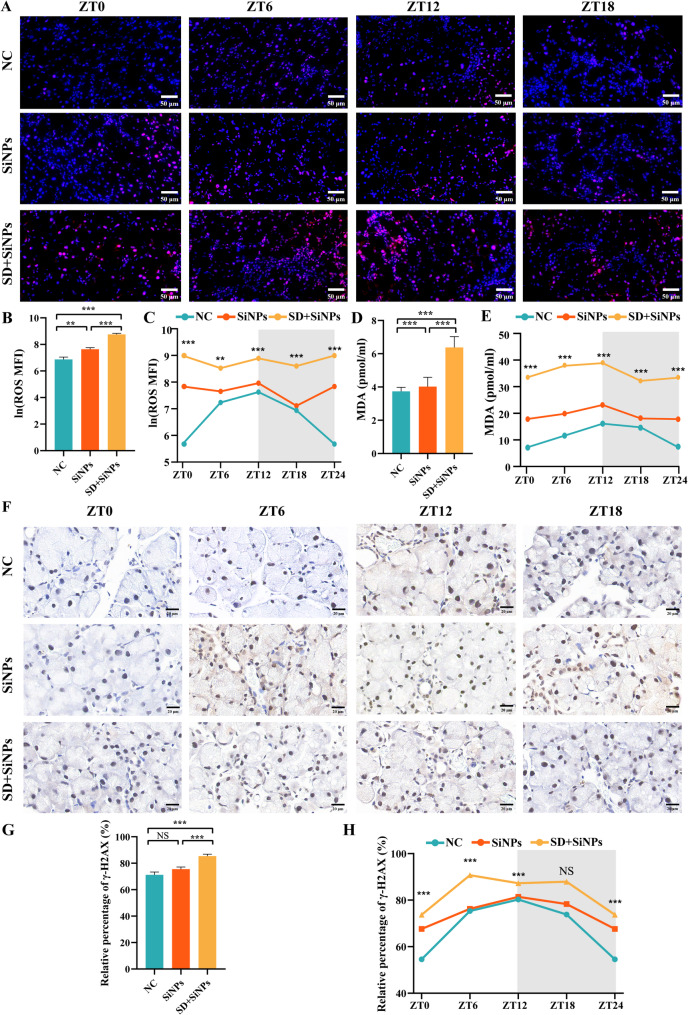
Sleep deprivation (SD) and exposure to engineered nanomaterials such as silica nanoparticles (SiNPs) are emerging risk factors for ocular surface disorders, particularly dry eye disease. However, the molecular mechanisms underlying their combined impact on lacrimal gland function remain unclear. In this study, we investigated the synergistic effects of SD and SiNPs exposure on circadian regulation, oxidative stress, inflammation, and structural integrity of the extraorbital lacrimal glands (ELGs) in C57BL/6J mice. Behavioral and physiological monitoring revealed that SD + SiNPs disrupted circadian locomotor activity and body temperature rhythms. Phenotypic assessments showed reduced tear secretion and ELG atrophy. RNA sequencing identified extensive transcriptomic reprogramming, including altered expression of core clock genes and enrichment of inflammatory and redox-related pathways. Increased reactive oxygen species (ROS) accumulation and γ-H2AX expression indicated oxidative DNA damage. Immunohistochemistry confirmed NLRP3 inflammasome activation, while Western blotting revealed enhanced phosphorylation of JAK2, STAT3, NF-κB p65, and IκBα, alongside upregulation of IL-17A. Elevated malondialdehyde levels further reflected oxidative lipid damage. These findings demonstrate that SD exacerbates SiNPs-induced ELG dysfunction via circadian disruption and activation of the ROS/NLRP3/IL-17A inflammatory axis. While these effects are currently limited to the lacrimal gland, future studies are needed to determine whether similar mechanisms contribute to broader systemic metabolic consequences.

Keywords: Circadian Rhythm Disruption; Environmental Nanotoxicology; Lacrimal Gland Dysfunction; NLRP3 Inflammasome; Oxidative Stress.


Conflict of interest statement

Declarations. Ethics approval and consent to participate: All experimental procedures were conducted following protocols approved by the Henan Provincial People’s Hospital’s Institutional Animal Care and Use Committee (HNEECA-2024-08), and were performed in accordance with ARRIVE guidelines. Consent for publication: Not applicable. Competing interests: The authors declare no competing interests.

Figures

Fig. 1
Fig. 1
Experimental design and analysis workflow for studying of SiNPs and the combined effects of SD and SiNPs. (A-C) Schematic representation of the behavioral activity monitoring protocol over a two-week period for the NC, SiNPs-treated, and SD + SiNPs-treated groups. The transition from the inactive phase (gray) to the active phase (black) is indicated. (D) The schematic diagram illustrates the experimental timeline for ELG collection over a 24-hour period. (E) Overview of phenotype profiling and analysis. The assessed phenotypes included locomotor activity, core body temperature, body weight, water intake, pellet intake, and tear secretion. ELG analysis involved measurements of ELG weight, cell size, immune cell infiltration, immunohistochemical analysis, ROS, and MDA analysis, and Western blot analysis. (F) Transcriptional profiling of ELGs was conducted, including the JTK cycling algorithm, KEGG pathway analysis, functional annotation using PSEA, time-series clustering analysis, and functional interaction network construction
Fig. 2
Fig. 2
Behavioral and physiological alterations in mice following SiNPs and SD + SiNPs treatments. (A-B) Locomotor activity patterns over a 24-hour period in the NC, SiNPs-treated, and SD + SiNPs-treated groups. Data were collected every 5 min. The gray shading indicates the dark phase. *P < 0.05, ***P < 0.001. (C-D) Core body temperature fluctuations over a 24-hour period in the NC, SiNPs-treated, and SD + SiNPs-treated groups. Data were recorded every 20 min. The gray shading indicates the dark phase. *P < 0.05, ***P < 0.001. (E) Pellet consumption in the NC, SiNPs-treated, and SD + SiNPs-treated groups. NS: not significant. (F) Water intake in the NC, SiNPs-treated, and SD + SiNPs-treated groups. NS: not significant. (G) Body weight changes in the NC, SiNPs-treated, and SD + SiNPs-treated groups. *P < 0.05, ***P < 0.001
Fig. 3
Fig. 3
Impact of SiNPs and SD + SiNPs treatment on ELG weight, tear secretion, and structural integrity. (A) Diurnal changes of ELG weight in the NC, SiNPs-treated, and SD + SiNPs-treated groups. *P < 0.05, ***P < 0.001. NS: not significant. (B) ELG weight measurements in the NC, SiNPs-treated, and SD + SiNPs-treated groups. **P < 0.01, ***P < 0.001. (C) Tear secretion was assessed using the phenol thread test at ZT 0, 6, 12, and 18 over a 24-hour cycle. Statistical significance is denoted as *P < 0.05 for comparisons between SiNPs-treated and SD + SiNPs-treated groups and ^P < 0.05 for comparisons between the NC and SD + SiNPs-treated groups. (D-F) Representative gross sections of ELGs from the NC (D), SiNPs-treated (E), and SD + SiNPs-treated (F) groups (scale bar: 500 μm, upper panels). Magnified views of the boxed regions show the acinar cell morphology (scale bar: 20 μm, lower panels). (G) Diurnal changes of ELG cell counts in the NC, SiNPs-treated, and SD + SiNPs-treated groups. *P < 0.05, ***P < 0.001. (H) Quantitative analysis of acinar cell counts in the NC, SiNPs-treated, and SD + SiNPs-treated groups. Statistical analysis was performed using Brown-Forsythe ANOVA. Multiple comparisons were conducted using the Games-Howell post hoc test. ***P < 0.001
Fig. 4
Fig. 4
Comparative transcriptomic analysis of mouse ELGs in response to SiNPs and SD + SiNPs treatments. (A–C) The pie charts illustrate the transcriptomic composition of ELGs in the NC, SiNPs-treated, and SD + SiNPs-treated groups, categorized into low-expressed, rhythmic, and non-rhythmic genes. (D) The PCA scatterplot depicts the overall gene expression profiles of ELGs in the NC (blue), SiNPs-treated (red), and SD + SiNPs-treated (yellow) groups. Each dot represents an individual animal sampled at three-hour intervals over a 24-hour cycle (N = 3 per time point). The shaded regions indicate the distribution of each group. (E) The line graph illustrates the temporal distribution of peak gene expression across different ZT points in the NC, SiNPs-treated, and SD + SiNPs-treated groups. Differences in peak expression times highlight the impact of treatments on rhythmic gene regulation. (F) The volcano plot visualizes DEGs in ELGs between NC and SiNPs-treated mice. The x-axis represents ZT points, while the y-axis indicates fold change (FC). Red and gray dots denote genes with adjusted P-values < 0.01 and ≥ 0.01, respectively. Each group consisted of 24 mice
Fig. 5
Fig. 5
Effects of SiNPs and SD + SiNPs treatment on the rhythmic transcriptome of murine ELGs. (A) The venn diagram illustrates the overlap and divergence of rhythmic transcripts among the NC, SiNPs-treated, and SD + SiNPs-treated groups. (B) The heatmaps display the expression profiles of 1,094 rhythmic transcripts unique to the NC group at different ZT points. The left panel represents the NC group, while the middle and right panels correspond to the SiNPs-treated and SD + SiNPs-treated groups, respectively. Gene expression levels are normalized within a ± 2 range, as indicated by the color scale. (C) The heatmaps show the expression levels of 1,022 rhythmic transcripts exclusive to the SiNPs-treated group across various ZT points. The panel arrangement is consistent with (B), with the NC group on the left, the SiNPs-treated group in the middle, and the SD + SiNPs-treated group on the right. (D) The heatmaps illustrates the expression patterns of 1,409 rhythmic transcripts unique to the SD + SiNPs-treated group over multiple ZT points, following the same panel arrangement as in (B) and (C). (E) The venn diagram depicts the transition of rhythmic genes in the NC group to either non-rhythmic (blue) or low-expressed (red) genes in the SiNPs-treated group. (F) The venn diagram illustrates the conversion of rhythmic genes in the SiNPs-treated group into non-rhythmic (red) or low-expressed (yellow) genes in the SD + SiNPs-treated group. (G-H) The wind rose diagrams represent the mean vector and length of rhythmic genes unique to each group (G) and those shared across all three groups (H). The NC, SiNPs-treated, and SD + SiNPs-treated groups are positioned on the right, middle, and left, respectively
Fig. 6
Fig. 6
Impact of SiNPs and SD + SiNPs treatment on KEGG and phase-clustered pathways in mouse ELGs. (A–D) Gene annotation of KEGG pathways significantly enriched in rhythmic genes unique to the NC group (A), SiNPs-treated group (B), SD + SiNPs-treated group (C), and those shared among all three groups (D), with P < 0.01. The top 10 enriched pathways are presented. The upper horizontal axis, aligned with the orange line graph, represents the number of term candidate genes, while the lower horizontal axis, aligned with the blue histogram, represents the -log10 (P-value), indicating the statistical significance of enrichment. (E–G) Summary of significantly phase-clustered pathways (P < 0.05) unique to the NC group (E), SiNPs-treated group (F), and SD + SiNPs-treated group (G). The inner circle and column length represent the phase distribution of rhythmic genes specific to each group. The outer red line marks KEGG pathways (P < 0.05) associated with rhythmic genes unique to each group, indicating enrichment at distinct ZT points, as determined by the phase distribution in the inner circle. Gray shading indicates dark cycles
Fig. 7
Fig. 7
Impact of SiNPs and SD + SiNPs treatment on the circadian gene clustering profile and KEGG pathways in murine ELGs. (A–L) Temporal gene expression Z-scores for four distinct enriched clusters unique to the NC group (A–D), SiNPs-treated group (E–H), and SD + SiNPs-treated group (I–L). Blue, orange, and yellow lines represent genes with low membership values, while pink, purple, and green lines indicate genes with high membership values. Gray shading denotes dark cycles. The corresponding right-side panels display the top 10 KEGG pathways (P < 0.05) enriched for circadian genes unique to each group and cluster
Fig. 8
Fig. 8
Impact of SiNPs and SD + SiNPs treatment on circadian transcription in murine ELGs. (A) The 24-hour expression profiles of 12 core clock genes, including Nr1d1 (REV-ERBα), Nr1d2 (REV-ERBβ), Clock, Per1, Per2, Per3, Arntl (Bmal1), Cry1, Cry2, Npas2, Rora, and Rorc, are presented. The x-axis represents the sampling time points, while the y-axis indicates gene expression levels at specific ZT points. The green, orange, and yellow lines correspond to the NC, SiNPs-treated, and SD + SiNPs-treated groups, respectively. Gray shading denotes the dark phase of the LD cycle. Three animals per group were sampled every three hours. At each time point, independent samples t-tests were applied to assess differences between the NC and SiNPs-treated groups, the NC and SD + SiNPs-treated groups, and the SiNPs-treated and SD + SiNPs-treated groups. Statistical significance is indicated as follows: *P < 0.05, **P < 0.01, ***P < 0.001 for comparisons between the NC and SiNPs-treated groups; ^P < 0.05, ^^P < 0.01, ^^^P < 0.001 for comparisons between the NC and SD + SiNPs-treated groups; and sP < 0.05, ssP < 0.01, sssP < 0.001 for comparisons between the SiNPs-treated and SD + SiNPs-treated groups. (B) The distribution of peak phases for core clock genes is shown for the NC, SiNPs-treated, and SD + SiNPs-treated groups. Gray shading represents the dark phase of the circadian cycle
Fig. 9
Fig. 9
Impact of SiNPs and SD + SiNPs treatment on immune cells and genes in murine ELGs. (A) Representative immunohistochemical images of CD4+ T cells in murine ELGs at ZT0 and ZT12, from NC, SiNPs-treated and SiNPs + SD-treated groups. Scale bar: 20 μm. (B) Representative immunohistochemical images of CD8+ T cells in murine ELGs at ZT0 and ZT12, from the NC, SiNPs-treated, and SD + SiNPs-treated groups. Scale bar: 50 μm. (C) Quantitative analysis of CD4+ T cell in murine ELGs, comparing the diurnal variation of positive cell ratio among the NC group, the SiNPs-treated group and the SD + SiNPs-treated group. **P < 0.01. (D) Average abundance of CD4+ T cell in murine ELGs from the NC, the SiNPs-treated and the SD + SiNPs-treated groups. Statistical analysis was performed using the Kruskal–Wallis test (non-parametric), followed by Dunn’s post hoc test for multiple comparisons. *P < 0.05, ***P < 0.001. (E) Quantitative analysis of CD8+ T cell in murine ELGs, comparing the diurnal variation of positive cell ratio among NC group, SiNPs-treated group and SD + SiNPs-treated group. For NC group, P = 0.3391. For SiNPs-treated group, P = 0.4931. For SD + SiNPs-treated group, P = 0.0001. *P < 0.05, **P < 0.01, ***P < 0.001. NS: not significant. (F) Average abundance of CD8+ T cells in murine ELGs from NC, SiNPs-treated and SD + SiNPs-treated groups. **P < 0.01. (G) Heatmaps of diurnal expression for immune-related DEGs between the NC group and SiNPs-treated group in murine ELGs. The expression levels of immune-related genes were obtained from RNA-Seq and expression range of DEGs was normalized to ± 3. (H) The PPINs and functional clusters (cluster 1–3) with relevant KEGG pathways of immune-related genes between the SiNPs-treated group and SD + SiNPs-treated group. (I) The top 10 KEGG pathways enriched histogram of immune-related genes with P < 0.05 were displayed. (J) Immunoblotting of phosphorylation of STAT3, JAK2, phosphorylation of IκBα and p65, and IL17A in ELGs at ZT0 and ZT12, from NC, SiNPs-treated and SD + SiNPs-treated groups
Fig. 10
Fig. 10
Immune alterations in murine ELGs following SiNPs and SD + SiNPs treatments. (A) Heatmaps of diurnal expression for nerve-related DEGs between the NC group and SiNPs-treated group in murine ELGs. The expression levels of immune-related genes were obtained from RNA-Seq and expression range of DEGs was normalized to ± 4. (B) The PPINs and functional clusters (cluster 1–3) with relevant KEGG pathways of nerve-related genes between the NC group and SiNPs-treated group. (C) The top 10 KEGG pathways enriched histogram of nerve-related genes with P < 0.05 were displayed. (D) Representative images of anti-β-III tubulin immunostaining in ELGs from the NC, SiNPs, and SD + SiNPs groups. Scale bar:20 μm. (E) Quantitative analysis of anti-β-III tubulin staining in ELGs from the NC, SiNPs, and SD + SiNPs groups. Statistical analysis was performed using Brown-Forsythe ANOVA. Multiple comparisons were conducted using the Games-Howell post hoc test. For NC vs. SiNPs, P = 0.0007. For NC vs. SD + SiNPs, P < 0.0001. For SiNPs vs. SD + SiNPs, P < 0.0001. ***P < 0.001
Fig. 11
Fig. 11
Oxidative stress and DNA damage in murine ELGs following SiNPs and SD + SiNPs treatments. (A) Representative images showing ROS levels at ZT0, ZT6, ZT12, and ZT18 in murine ELGs from the NC, SiNPs-treated, and SD + SiNPs-treated groups. Scale bar: 50 μm. (B) Quantitative analysis of ROS levels in murine ELGs from NC, SiNPs-treated, and SD + SiNPs-treated groups. Mean fluorescence intensity (MFI) values of ROS were log-transformed using the natural logarithm (ln) to improve normality before statistical analysis. Statistical analysis was performed using Brown-Forsythe ANOVA. Multiple comparisons were conducted using the Games-Howell post hoc test. For NC vs. SiNPs, P = 0.002. For NC vs. SD + SiNPs, P < 0.0001. For SiNPs vs. SD + SiNPs, P < 0.0001. **P < 0.01, ***P < 0.001. (C) Diurnal changes of ROS levels in murine ELGs from NC, SiNPs-treated, and SD + SiNPs-treated groups. Statistical analyses were performed on natural log-transformed data. For the NC group, F = 19.65, P < 0.0001. For the SiNPs-treated group, F = 3.794, P = 0.0265. For the SD + SiNPs-treated group, F = 1.957, P = 0.1499. **P < 0.01, ***P < 0.001. (D) Quantitative analysis of MDA levels in murine ELGs from the NC, SiNPs-treated, and SD + SiNPs-treated groups. Statistical analysis was performed using Brown-Forsythe ANOVA. Multiple comparisons were conducted using the Games-Howell post hoc test. For NC vs. SiNPs, P < 0.001. For NC vs. SD + SiNPs, P < 0.001. For SiNPs vs. SD + SiNPs, P < 0.001. ***P < 0.001. (E) Diurnal changes of MDA levels in murine ELGs from the NC, SiNPs, SD + SiNPs. Statistical analyses were performed on natural log-transformed data. For the NC group, F = 57.601, P < 0.001. For the SiNPs-treated group, F = 4.732, P = 0.012. For the SD + SiNPs-treated group, F = 2.559, P = 0.084. ***P < 0.001. (F) Representative images showing γ-H2AX levels at ZT0, ZT6, ZT12, and ZT18 in murine ELGs from the NC, SiNPs-treated, and SD + SiNPs-treated groups. Scale bar: 20 μm. (G) Quantitative analysis of γ-H2AX levels in murine ELGs from the NC, SiNPs-treated, and SD + SiNPs-treated groups. Statistical analysis was performed using the Kruskal–Wallis test (non-parametric), followed by Dunn’s post hoc test for multiple comparisons. For NC vs. SiNPs, P = 0.8374. For NC vs. SD + SiNPs, P < 0.0001. For SiNPs vs. SD + SiNPs, P = 0.0006. ***P < 0.001. NS: not significant. (H) Diurnal changes of γ-H2AX levels in murine ELGs from the NC, SiNPs-treated, and SD + SiNPs-treated groups. For the NC group, F = 32.35, P < 0.0001. For the SiNPs-treated group, F = 7.167, P = 0.0017. For the SD + SiNPs-treated group, F = 20.02, P < 0.0001. ***P < 0.001. NS, not significant
Fig. 12
Fig. 12
SD potentiates SiNPs-induced NLRP3 inflammasome activation in mouse ELGs. (A) Representative immunohistochemical images of NLRP3+ cells in mouse ELGs at ZT0 and ZT12 for the NC, SiNPs-treated, and SD + SiNPs-treated groups. Scale bar: 20 µm. (B) Average abundance of NLRP3+ cells of ELGs from NC, SiNPs-treated, and SD + SiNPs-treated groups. Statistical analysis was performed using the Kruskal–Wallis test (non-parametric), followed by Dunn’s post hoc test for multiple comparisons. Dunn’ s test showed that the SD + SiNPs-treated group differed significantly from the NC group (***P < 0.001) and the SiNPs-treated group (*P < 0.05), while the NC group, and the SiNPs-treated group were not significantly different (NS). (C) Diurnal variation analysis of NLRP3+ cell ratio in murine ELGs across the NC, SiNPs-treated group, and the SD + SiNPs-treated groups. Statistical analysis showed no significant diurnal variations in any group (ZT0: F = 1.419, P = 0.2665; ZT6: F = 19.05, P < 0.001; ZT12: F = 1.227, P = 0.3134; ZT18: F = 17.68, P < 0.001). ***P < 0.001. NS: not significant. (D) Diurnal variation analysis of ASC+ cells ratio in murine ELGs across NC group, SiNPs-treated group, and SD + SiNPs-treated group. For ZT0, F = 11.50, P = 0.0005; For ZT6, F = 10.98, P = 0.0008; For ZT12, F = 1.227, P = 0.005; For ZT18, F = 17.68, P < 0.0001. **P < 0.01, ***P < 0.001. (E) Representative immunofluorescence images of ASC+ cells in mouse ELGs at ZT0, ZT6, ZT12, and ZT18 time points for the NC group, the SiNPs-treated group, and the SD + SiNPs-treated group. Scale bar: 50 μm. (F-I) Quantitative analysis of average fluorescence signal intensity of ASC in mouse ELGs at ZT0 (G), ZT6 (H), ZT12 (I), and ZT18 (J) for the NC group, SiNPs-treated group, and SD + SiNPs-treated group. Statistical analysis revealed significant differences at all time points: ZT0 (F = 11.50, P = 0.0005), ZT6 (F = 10.98, P = 0.0008), ZT12 (F = 1.227, P = 0.005), and ZT18 (F = 17.68, P < 0.0001). **P < 0.01, ***P < 0.001
Fig. 13
Fig. 13
Schematic illustration of the proposed mechanism linking SiNPs exposure and sleep deprivation to dry eye pathogenesis. The diagram summarizes how combined exposure to silica nanoparticles (SiNPs) and sleep deprivation (SD) disrupts circadian homeostasis, resulting in impaired tear secretion, lacrimal gland atrophy, immune cell infiltration, and oxidative DNA damage. These pathological changes are mediated by increased reactive oxygen species (ROS) production and activation of the NLRP3 inflammasome, as indicated by elevated γ-H2AX expression. The figure underscores the interplay between circadian disruption, oxidative stress, and inflammation in driving lacrimal gland dysfunction (This figure was created using the Servier Medical ART: SMART [smart.servier.com] according to a Creative Commons Attribution 3.0 license.)

References

    1. Stark WJ, Stoessel PR, Wohlleben W, Hafner A. Industrial applications of nanoparticles. Chem Soc Rev. 2015;44:5793–805. - PubMed
    1. Dubey SK, Dey A, Singhvi G, Pandey MM, Singh V, Kesharwani P. Emerging trends of nanotechnology in advanced cosmetics. Colloid Surf B. 2022;214:112440. - PubMed
    1. Croissant JG, Butler KS, Zink JI, Brinker CJ. Synthetic amorphous silica nanoparticles: toxicity, biomedical and environmental implications. Nat Rev Mater. 2020;5:886–909.
    1. Joudeh N, Linke D. Nanoparticle classification, physicochemical properties, characterization, and applications: a comprehensive review for biologists. J Nanobiotechnol. 2022;20: 262. - PMC - PubMed
    1. Medina C, Santos-Martinez MJ, Radomski A, Corrigan OI, Radomski MW. Nanoparticles: Pharmacological and toxicological significance. Br J Pharmacol. 2007;150:552–8. - PMC - PubMed

MeSH terms

LinkOut - more resources