

Development and validation of a nomogram for predicting overall and cancer-specific survival in elderly patients (≥ 65 years) with epithelial ovarian cancer
- PMID: 40890885
- PMCID: PMC12400609
- DOI: 10.1186/s40001-025-03114-0
Development and validation of a nomogram for predicting overall and cancer-specific survival in elderly patients (≥ 65 years) with epithelial ovarian cancer
Abstract
Background: Current evidence indicates an uptick in both morbidity and mortality rates of epithelial ovarian cancer (EOC) among the elderly (65 year and older) over the past few years. To date, standardized treatment for elderly patients remains undeveloped. This study utilizes the Surveillance, Epidemiology, and End Results (SEER) database to extract relevant clinicopathological data and construct two nomograms aimed at predicting the prognosis of elderly (65 year and older) patients with EOC. This objective is intended to assist clinicians during clinical decision-making and to assist in individualized prognostication and support clinical decision-making of elderly (65 year and older) EOC patient.
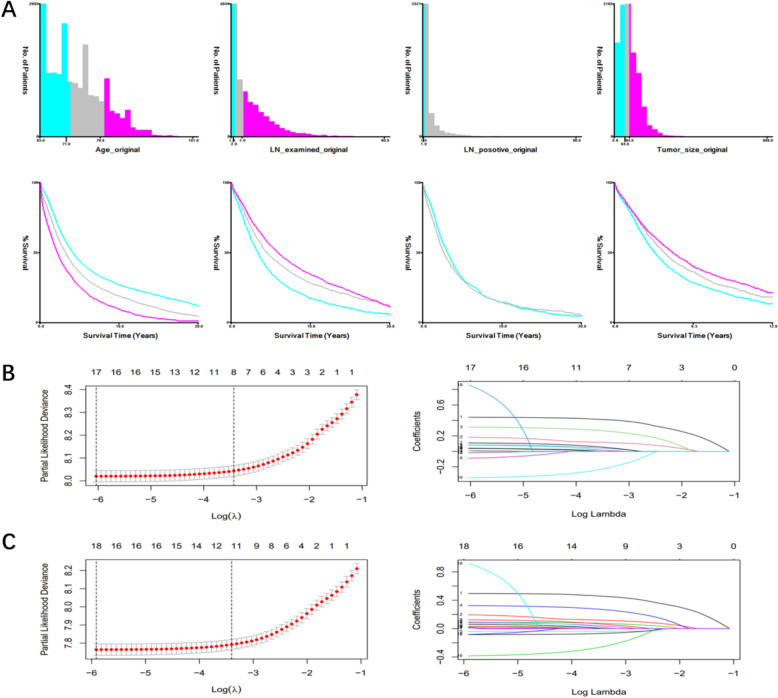
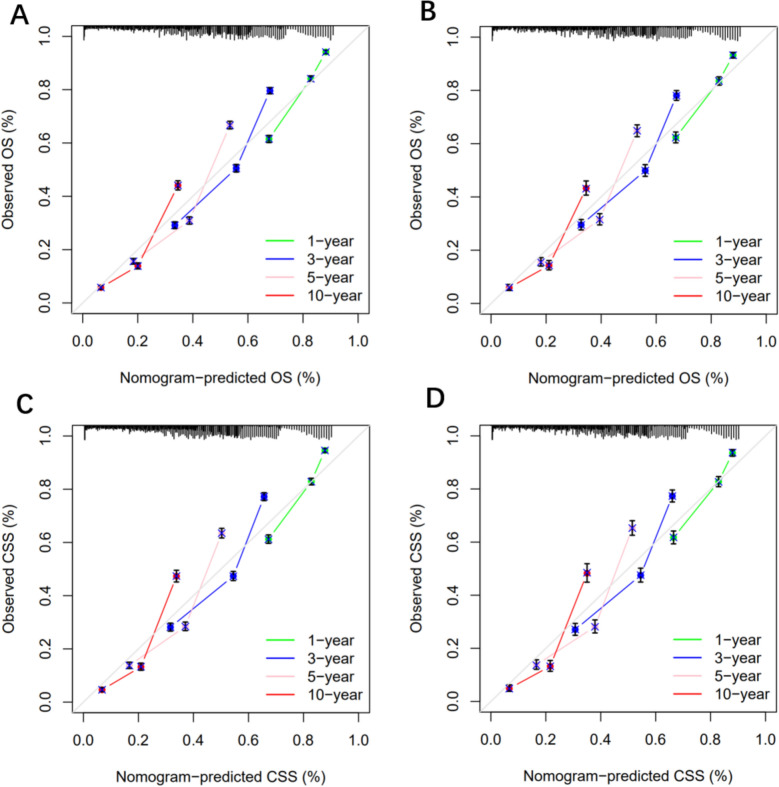
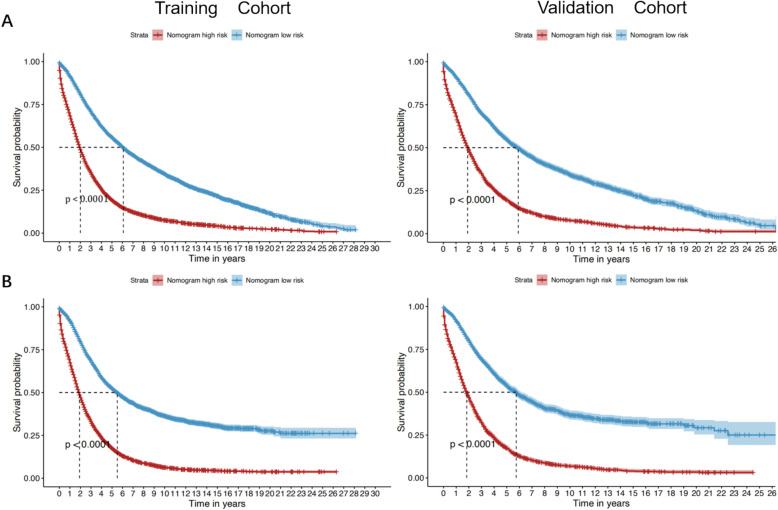
Methods: Our analysis screened a total of 22,181 eligible patients, randomly divided into a training cohort (n = 15,529) and validation cohort (n = 6652) at a ratio of 7:3. 64 cases over 65 year old EOC patient were collected for external validation in our hospital. COX and LASSO analyses were used to screen the independent risk factors for overall survival (OS) and cancer-specific survival (CSS) in elderly patients with EOC. The independent risk factors were used to establish a nomogram by using the "rms" package. The predictive and clinical utility of nomograms was assessed using concordance index, area under the curve (AUC), calibration curve, decision curve analysis and external validation. Kaplan-Meier analysis was conducted to further stratify OS and CSS in high and low-risk groups, assessing the nomograms' stratification efficacy.
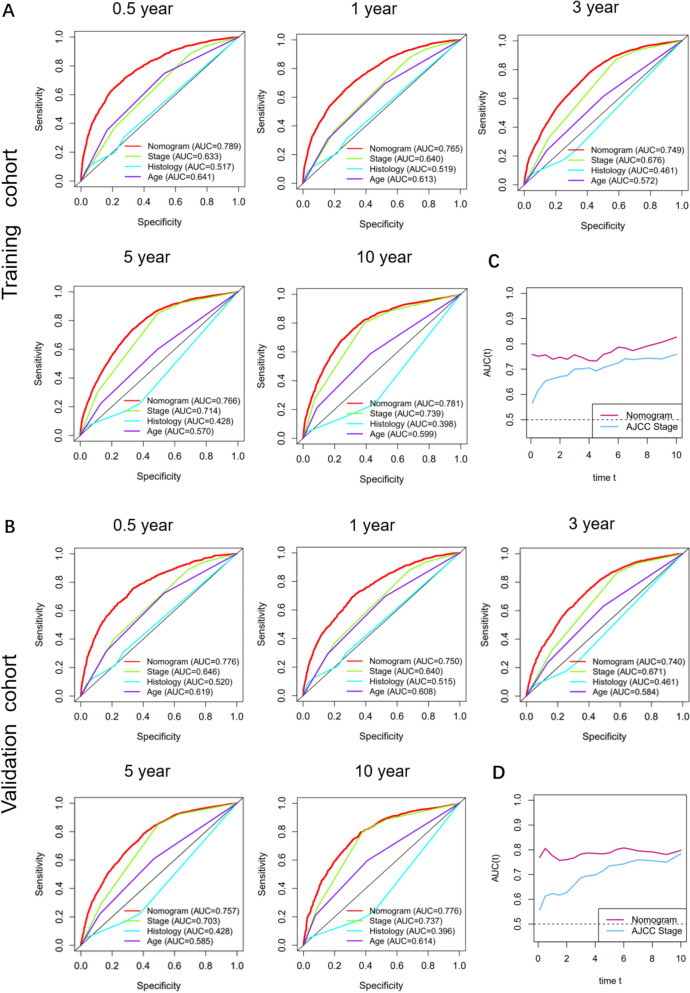
Results: The AUCs of the training and validation cohort for OS and CSS prediction at 0.5, 1, 3, 5, and 10 years were significantly higher than the American Joint Committee on Cancer (AJCC) staging system (8th edition). Time-dependent AUC analysis from 1 to 10 years confirmed the nomograms' predictive superiority over the AJCC staging system for both OS and CSS in the training and validation cohorts. Compared with the age, AJCC staging system, the DCA curves of the nomogram showed a greater net gain in the training and external validation cohorts. In the external validation group, C-index of nomogram was 0.938 [95% CI 0.888-0.988], which was significantly better than that of stage (0.762) [95% CI 0.693-0.832] and the results showed that the AUC of Nomogram was significantly higher than that of stage at 1, 3, and 5-year OS and CSS. KM analysis showed that the prognosis of the low-risk group was significantly higher than that of the high-risk group. The developed nomograms outperformed the AJCC staging system in predicting both OS and CSS in elderly (65 year and older) EOC patient.
Conclusions: The developed nomograms offer an effective method for predicting the OS and CSS of elderly ovarian cancer patients, aiding clinicians in making personalized survival projections and refining treatment recommendations.
Keywords: Cancer-specific survival; Elderly patients; Epithelial ovarian cancer; Nomogram; Overall survival.
© 2025. The Author(s).
Conflict of interest statement
Declarations. Ethics approval and consent to participate: All analyses were conducted in accordance with relevant regulations and guidelines. Consent for publication: All authors agree to publish. Competing interests: The authors declare no competing interests.
Figures


References
-
- Siegel RL, Miller KD, Fuchs HE, Jemal A. Cancer statistics, 2022. CA Cancer J Clin. 2022;72(1):7–33. - PubMed
-
- Armstrong DK, Alvarez RD, Bakkum-Gamez JN, Barroilhet L, Behbakht K, Berchuck A, et al. Ovarian cancer, version 2.2020, NCCN clinical practice guidelines in oncology. J Natl Compr Canc Netw. 2021;19(2):191–226. - PubMed
-
- Malvezzi M, Carioli G, Rodriguez T, Negri E, La Vecchia C. Global trends and predictions in ovarian cancer mortality. Ann Oncol. 2016;27(11):2017–25. - PubMed
Publication types
MeSH terms
LinkOut - more resources
Full Text Sources
Medical
Miscellaneous
