

Interpretable Machine Learning Models for Predicting Malignant Ventricular Arrhythmia in Patients with Acute ST-Segment Elevation Myocardial Infarction Based on Systemic Inflammation Index
- PMID: 40891009
- PMCID: PMC12402570
- DOI: 10.1177/10760296251375795
Interpretable Machine Learning Models for Predicting Malignant Ventricular Arrhythmia in Patients with Acute ST-Segment Elevation Myocardial Infarction Based on Systemic Inflammation Index
Abstract
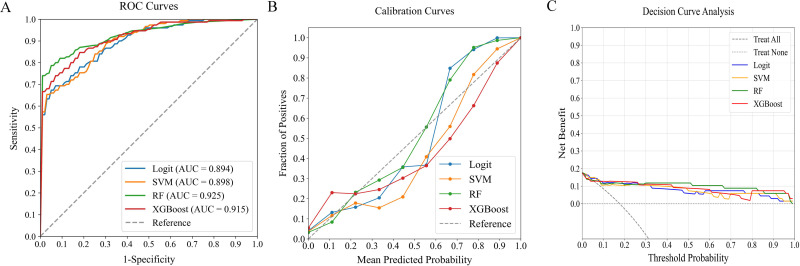
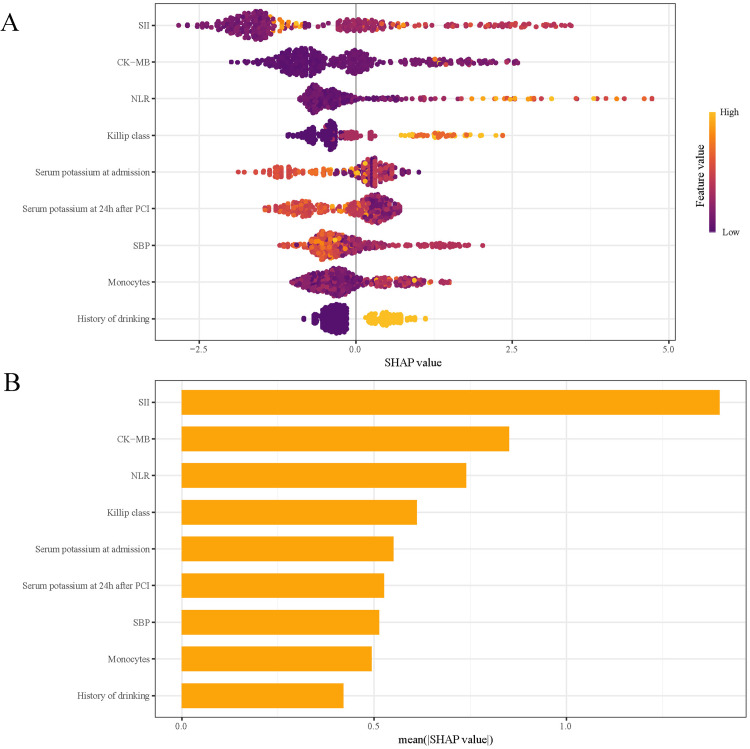
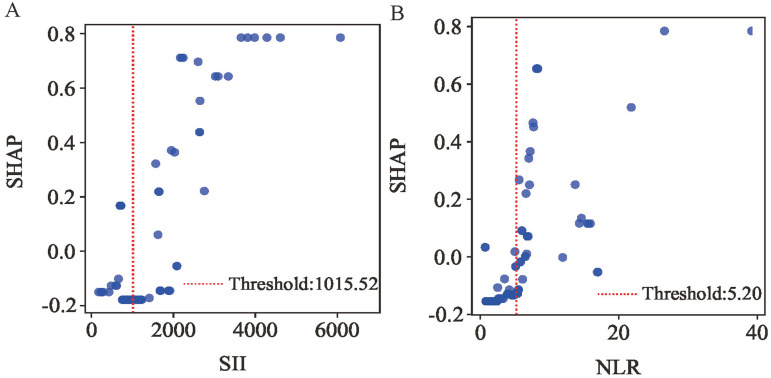
BackgroundPercutaneous coronary intervention (PCI) improves outcomes in ST-segment elevation myocardial infarction (STEMI) by restoring myocardial perfusion. However, post-procedural malignant ventricular arrhythmias (MVA), as a serious complication, can cause hemodynamics instability and lead to in-hospital sudden cardiac death. Systemic inflammation indices serve as reliable biomarkers of inflammatory status and may predict arrhythmia risk. Current prediction models, however, frequently overlook key inflammatory markers and predominantly rely on traditional linear methods rather than advanced machine learning (ML) techniques. To address this limitation, our study developed an interpretable ML model using systemic inflammation indices to predict in-hospital MVA risk in STEMI patients following emergency PCI, thereby facilitating clinical decision-making.MethodsWe retrospectively analyzed 485 consecutive STEMI patients, dividing them into training and temporal validation cohorts. Based on clinical outcomes, patients were stratified into MVA and non-MVA groups. In the training cohort, we developed and internally validated multiple ML models using three predictor sets: (1) systemic inflammation indices alone, (2) traditional clinical indicators alone, and (3) their combination. The models' performance was subsequently assessed in the temporal validation cohort. For the optimal model, we employed SHAP (Shapley Additive Explanations) values to evaluate feature importance and enhance model interpretability.ResultsAmong the 485 enrolled patients, 88 (18.1%) developed MVA during hospitalization. Nine predictors, including systemic inflammation indices and traditional clinical markers, were significantly associated with MVA risk. The random forest (RF) model demonstrated superior predictive performance, achieving an area under the receiver operating characteristic (ROC) curve (AUC) of 0.925, outperforming logistic regression (Logit, AUC: 0.894), support vector machines (SVM, AUC: 0.898), and extreme gradient boosting (XGBoost, AUC: 0.915). SHAP analysis identified five key predictors-two systemic inflammation indices and three traditional clinical markers-as the most influential factors for assessing in-hospital MVA risk in STEMI patients after emergency PCI.ConclusionThe RF model, integrating both systemic inflammation indices and traditional clinical indicators, provides an effective tool for predicting in-hospital MVA in STEMI patients following PCI. This ML approach enhances risk stratification accuracy, facilitating early clinical intervention to mitigate MVA occurrence.
Keywords: ST-segment elevation myocardial infarction; machine learning; malignant ventricular arrhythmia; percutaneous coronary intervention; systemic inflammation index.
Conflict of interest statement
Declaration of Conflicting InterestsThe authors declared no potential conflicts of interest with respect to the research, authorship, and/or publication of this article. Data Availability StatementAll data supporting this study are included in the article, and additional inquiries can be addressed to the corresponding author.
Figures


Similar articles
-
An interpretable radiomics-based machine learning model for predicting reverse left ventricular remodeling in STEMI patients using late gadolinium enhancement of myocardial scar.Eur Radiol. 2025 Oct;35(10):6302-6312. doi: 10.1007/s00330-025-11419-1. Epub 2025 Apr 3. Eur Radiol. 2025. PMID: 40180637
-
Prediction of Percutaneous Coronary Intervention Success in Patients With Moderate to Severe Coronary Artery Calcification Using Machine Learning Based on Coronary Angiography: Prospective Cohort Study.J Med Internet Res. 2025 Jul 11;27:e70943. doi: 10.2196/70943. J Med Internet Res. 2025. PMID: 40644630 Free PMC article.
-
Optimized feature selection and advanced machine learning for stroke risk prediction in revascularized coronary artery disease patients.BMC Med Inform Decis Mak. 2025 Jul 24;25(1):276. doi: 10.1186/s12911-025-03116-2. BMC Med Inform Decis Mak. 2025. PMID: 40707947 Free PMC article.
-
Comparing the Performance of Machine Learning Models and Conventional Risk Scores for Predicting Major Adverse Cardiovascular Cerebrovascular Events After Percutaneous Coronary Intervention in Patients With Acute Myocardial Infarction: Systematic Review and Meta-Analysis.J Med Internet Res. 2025 Jul 18;27:e76215. doi: 10.2196/76215. J Med Internet Res. 2025. PMID: 40680235 Free PMC article.
-
Complete versus culprit-only revascularisation in ST elevation myocardial infarction with multi-vessel disease.Cochrane Database Syst Rev. 2017 May 3;5(5):CD011986. doi: 10.1002/14651858.CD011986.pub2. Cochrane Database Syst Rev. 2017. PMID: 28470696 Free PMC article.
References
-
- Motawea KR, Gaber H, Singh RB, Swed S. Effect of early metoprolol before PCI in ST-segment elevation myocardial infarction on infarct size and left ventricular ejection fraction. A systematic review and meta-analysis of clinical trials. Clin Cardiol. 2022;45(10):1011‐1028. DOI: 10.1002/clc.23894 - DOI - PMC - PubMed
-
- Zhang H, Qiu B, Zhang Y, et al. The value of Pre-infarction angina and plasma D-dimer in predicting No-reflow after primary percutaneous coronary intervention in ST-segment elevation acute myocardial infarction patients. Med Sci Monit. 2018;24:4528‐4535. DOI: 10.12659/msm.909360 - DOI - PMC - PubMed
MeSH terms
LinkOut - more resources
Full Text Sources
Medical
Miscellaneous
