. 2025 Sep 2:14:RP106525.
doi: 10.7554/eLife.106525.

Gene expression variation across genetically identical individuals predicts reproductive traits

Affiliations

Gene expression variation across genetically identical individuals predicts reproductive traits

Amy K Webster et al. Elife. .

Abstract

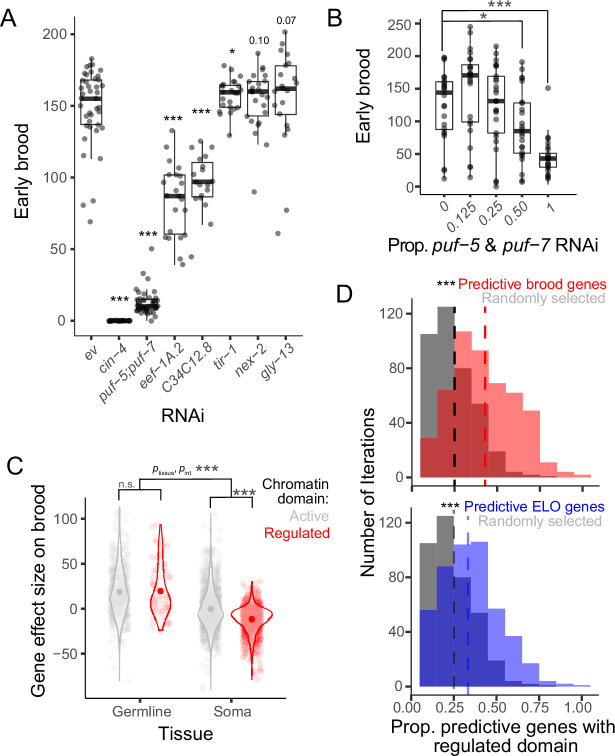
In recent decades, genome-wide association studies (GWAS) have been the major approach to understand the biological basis of individual differences in traits and diseases. However, GWAS approaches have limited predictive power to explain individual differences, particularly for complex traits and diseases in which environmental factors play a substantial role in their etiology. Indeed, individual differences persist even in genetically identical individuals, although fully separating genetic and environmental causation is difficult in most organisms. To understand the basis of individual differences in the absence of genetic differences, we measured two quantitative reproductive traits in 180 genetically identical young adult Caenorhabditis elegans roundworms in a shared environment and performed single-individual transcriptomics on each worm. We identified hundreds of genes for which expression variation was strongly associated with reproductive traits, some of which depended on individuals' historical environments and some of which was random. Multiple small sets of genes together were highly predictive of reproductive traits, explaining on average over half and over a quarter of variation in the two traits. We manipulated mRNA levels of predictive genes to identify a set of causal genes, demonstrating the utility of this approach for both prediction and understanding underlying biology. Finally, we found that the chromatin environment of predictive genes was enriched for H3K27 trimethylation, suggesting that gene expression variation may be driven in part by chromatin structure. Together, this work shows that individual, non-genetic differences in gene expression are both highly predictive and causal in shaping reproductive traits.

Keywords: C. elegans; environmental variation; epigenetics; gene expression; genetics; genomics; reproduction.


Conflict of interest statement

AW, JW, EJ, PS, PP No competing interests declared

Figures

Figure 1.
Figure 1.. Differences in early brood across isogenic individuals are associated with expression levels of hundreds of genes.
(A) Experimental design for single-individual mRNA-seq. P0 worms are allowed to lay progeny as day 1 or 3 adults. F1 progeny are either subject to a constant temperature or an 8-hr shift to 25°C. Beginning in mid-larval stages, all F1 worms experience the same environment. For each F1 worm, time to egg-laying onset is scored. 24 hr after egg-laying onset, each F1 worm is collected for single-individual mRNA-seq. F2 progeny laid on plates in the first 24 hr of egg-laying are counted to determine the early brood of each F1 worm. (B) Each of 8824 expressed genes was analyzed in a mixed model to assess the strength of its association with early brood. Significant genes are in pink (positively associated) or purple (negatively associated), non-significant genes are in black. Significance determined by a Bonferroni-corrected p-value cutoff of 0.05 (nominal p-value of 5.67 × 10⁻⁶). Phenotypic and expression data for each worm is shown for the top two genes, col-20 and phb-1, with linear model fits in black and 95% confidence intervals in gray. (C) Heatmap of 448 brood-associated genes for all 180 individuals. Worms are sorted from left to right from lowest to highest early brood. Early brood data and environmental information is shown in the bars at the top. Genes are sorted into two clusters based on whether the association was positive or negative.
Figure 1—figure supplement 1.
Figure 1—figure supplement 1.. Isogenic worms at the same developmental stage exhibit variability in egg-laying onset and early brood that partially depends on previous environmental conditions.
(A) Univariate histograms of early brood and egg-laying onset trait values for all worms. (B) Bivariate scatterplots of early brood and egg-laying onset trait for all worms. The same data is plotted twice but color-coded according to two previous environmental perturbations (age of parent and early-life temperature). Center lines for box plots indicate median; box limits indicate upper and lower quartiles. Significance determined using a linear mixed model with environmental perturbation as a fixed effect and biological replicate as a random effect, ***p < 0.001, *p < 0.05.
Figure 1—figure supplement 2.
Figure 1—figure supplement 2.. Variation in 11 genes is significantly associated with egg-laying onset.
Each of the 8824 expressed genes was analyzed in a mixed model to assess the strength of its association with egg-laying onset. Significant genes are in red, non-significant genes are in black. Significance determined by a Bonferroni-corrected p-value cutoff of 0.05 (nominal p-value of 5.67 × 10⁻⁶). Phenotypic and expression data for each worm is shown for two exemplar genes, anmt-3 and rnp-8. Black lines from linear model fit and gray shading indicates 95% confidence intervals.
Figure 2.
Figure 2.. Associations between gene expression and reproductive traits are partially driven by both noise and historical environment.
(A) Two example path analyses showing the relationship between gene expression and early brood. In Model 1, gene expression of a particular gene, puf-5, drives differences in early brood, and β1 is the coefficient of the linear mixed model. β1 represents the total effect of gene expression on early brood. In Model 2, β2 represents the effect of puf-5 on early brood that is independent of the historical environment. (B) Two example path analyses showing the relationship between gene expression and egg-laying onset, analogous to A. In Model 1, β1 is the total effect of grsp-4 on egg-laying onset, while in Model 2, β2 represents the effect of grsp-4 that is independent of historical environment. (C) The 448 genes for which expression variation is significantly associated with early brood, ordered by the magnitude of their β1 effect sizes. The absolute values of β1 and β2 are plotted upward and downward, respectively, for each gene. (D) The 11 genes for which expression variation is significantly associated with egg-laying onset across individuals, ordered by the magnitude of their β1 effect sizes. The absolute values of β1 and β2 are plotted upward and downward, respectively, for each gene. For C and D, legend indicates the −log10(p-value) of β1 and β2 for each gene. (E) Gene Ontology (GO) Terms for the 448 genes associated with early brood with a q-value <0.01 are shown. GO Terms for the two subsets of the 448 genes with overlapping GO Terms are also shown: 114 genes that have significant values of β2 but parental age does not have a significant effect on expression (‘noise’ genes), and 97 genes that do not have significant values of β2 but parental age does have a significant effect on expression (parental age genes).
Figure 3.
Figure 3.. Multi-gene models are highly predictive of early brood and egg-laying onset (ELO) at an individual level.
(A) Total R2 of gene expression principal components (PCs) in a multiple regression. PCs explain early brood (red), ELO (blue), and randomized data (dotted lines and gray shading). (B) Total R2 of top genes in a multiple regression. Gene sets explain early brood (red), ELO (blue), and randomized data (dotted lines and gray shading). For A and B, dotted lines represent average of randomized data iterations and gray shading indicates standard deviation. (C) Total R2 of top 10 genes in a multiple regression identified in a train set and total R2 of the same 10 genes used in a test set. Train and test sets randomly selected 500 times and top 10 genes identified in each iteration. Box plot center lines indicate median and box limits indicate upper and lower quartiles. An example of one iteration of train and test sets and corresponding model fits is shown for early brood. For D and E, machine learning model elastic net regression and leave-one-out cross-validation were used to identify a predicted trait for each worm given transcriptomic profile and compared to true trait data. Linear fit used to determine R2. Lines indicate linear fit, and gray indicates 95% confidence intervals. (D) Early brood model. (E) ELO model. (F) Proportion of 500 iterations from C in which a given gene is selected as one of the top 10 predictive genes for early brood, ordered by those selected from most to least often, and an inset showing the genes that are most frequently selected as predictive.
Figure 4.
Figure 4.. Genes predictive of reproductive traits causally affect early brood and are enriched for H3K27me3.
(A) RNA interference (RNAi) knockdown of selected predictive genes compared to empty vector (ev) and effects on early brood. (B) Dose response of puf-5 and puf-7 RNAi together with empty vector and effects on early brood. For A and B, linear mixed model with RNAi as fixed effect and biological replicate as a random effect. Center lines, median; box limits, upper and lower quartiles, *p < 0.05, ***p < 0.001. (C) Effect sizes on brood for genes categorized by tissue (soma or germline) and chromatin domain (active or regulated). Two-way ANOVA showed significant interaction between tissue and chromatin domain (p = 1.58 × 10⁻⁶) and a significant main effect of tissue (p < 2 × 10–16). Post hoc Tukey tests corrected for multiple testing showed a significant difference between chromatin domains within somatic tissues (adjusted p = 0) but not germline tissues (adjusted p = 0.98). Within somatic genes, active somatic genes effects on average do not differ from 0 (p = 0.3, one-sample t-test with μ = 0), while regulated somatic genes on average have a significant negative association with brood (p < 2.2 × 10⁻¹⁶, one-sample t-test with μ = 0), ***p < 0.001. (D) Histogram of all iterations identifying predictive gene sets and the proportion of each set in a regulated chromatin domain marked with H3K27me3 compared to randomly selected sets of genes from the same background set. Early brood iterations are shown in pink, egg-laying onset (ELO) in blue, and the same gray control is shown for both histograms. The vertical lines are color-coded to indicate the median proportion of genes in regulated domains in the corresponding condition. Kolmogorov–Smirnov test used to determine statistical significance, ***p < 0.001.
Figure 4—figure supplement 1.
Figure 4—figure supplement 1.. Single-individual mRNA-seq reveals most and least variable genes after controlling for environmental perturbations and biological replicate.
(A) Log10-transformed unexplained variance in mRNA-seq after controlling for environmental factors and biological replicate is plotted against log10-transformed average CPM across all worms and a loess fit line is shown in black with a 95% confidence interval in gray. Each point is a different gene and genes are color-coded according to their distance from the fit line. Genes in purple are most variable given their level of expression, while genes in pink are the least variable. Exemplar genes with comparable expression levels are shown on the right. Center lines for box plots indicate median; box limits indicate upper and lower quartiles. (B) Variance Z-scores for genes with regulated domains (H3K27me3) compared to variance Z-scores for genes with active domains (H3K36me3). Wilcoxon test, ***p < 2 × 10–16.

Update of

References

    1. Ahringer J. Reverse Genetics. WormBook; 2006. - DOI
    1. Ahringer J, Gasser SM. Repressive chromatin in Caenorhabditis elegans: establishment, composition, and function. Genetics. 2018;208:491–511. doi: 10.1534/genetics.117.300386. - DOI - PMC - PubMed
    1. Alsheikh AJ, Wollenhaupt S, King EA, Reeb J, Ghosh S, Stolzenburg LR, Tamim S, Lazar J, Davis JW, Jacob HJ. The landscape of GWAS validation; systematic review identifying 309 validated non-coding variants across 130 human diseases. BMC Medical Genomics. 2022;15:74. doi: 10.1186/s12920-022-01216-w. - DOI - PMC - PubMed
    1. Barban N, Jansen R, de Vlaming R, Vaez A, Mandemakers JJ, Tropf FC, Shen X, Wilson JF, Chasman DI, Nolte IM, Tragante V, van der Laan SW, Perry JRB, Kong A, Ahluwalia TS, Albrecht E, Yerges-Armstrong L, Atzmon G, Auro K, Ayers K, Bakshi A, Ben-Avraham D, Berger K, Bergman A, Bertram L, Bielak LF, Bjornsdottir G, Bonder MJ, Broer L, Bui M, Barbieri C, Cavadino A, Chavarro JE, Turman C, Concas MP, Cordell HJ, Davies G, Eibich P, Eriksson N, Esko T, Eriksson J, Falahi F, Felix JF, Fontana MA, Franke L, Gandin I, Gaskins AJ, Gieger C, Gunderson EP, Guo X, Hayward C, He C, Hofer E, Huang H, Joshi PK, Kanoni S, Karlsson R, Kiechl S, Kifley A, Kluttig A, Kraft P, Lagou V, Lecoeur C, Lahti J, Li-Gao R, Lind PA, Liu T, Makalic E, Mamasoula C, Matteson L, Mbarek H, McArdle PF, McMahon G, Meddens SFW, Mihailov E, Miller M, Missmer SA, Monnereau C, van der Most PJ, Myhre R, Nalls MA, Nutile T, Kalafati IP, Porcu E, Prokopenko I, Rajan KB, Rich-Edwards J, Rietveld CA, Robino A, Rose LM, Rueedi R, Ryan KA, Saba Y, Schmidt D, Smith JA, Stolk L, Streeten E, Tönjes A, Thorleifsson G, Ulivi S, Wedenoja J, Wellmann J, Willeit P, Yao J, Yengo L, Zhao JH, Zhao W, Zhernakova DV, Amin N, Andrews H, Balkau B, Barzilai N, Bergmann S, Biino G, Bisgaard H, Bønnelykke K, Boomsma DI, Buring JE, Campbell H, Cappellani S, Ciullo M, Cox SR, Cucca F, Toniolo D, Davey-Smith G, Deary IJ, Dedoussis G, Deloukas P, van Duijn CM, de Geus EJC, Eriksson JG, Evans DA, Faul JD, Sala CF, Froguel P, Gasparini P, Girotto G, Grabe HJ, Greiser KH, Groenen PJF, de Haan HG, Haerting J, Harris TB, Heath AC, Heikkilä K, Hofman A, Homuth G, Holliday EG, Hopper J, Hyppönen E, Jacobsson B, Jaddoe VWV, Johannesson M, Jugessur A, Kähönen M, Kajantie E, Kardia SLR, Keavney B, Kolcic I, Koponen P, Kovacs P, Kronenberg F, Kutalik Z, La Bianca M, Lachance G, Iacono WG, Lai S, Lehtimäki T, Liewald DC, Lindgren CM, Liu Y, Luben R, Lucht M, Luoto R, Magnus P, Magnusson PKE, Martin NG, McGue M, McQuillan R, Medland SE, Meisinger C, Mellström D, Metspalu A, Traglia M, Milani L, Mitchell P, Montgomery GW, Mook-Kanamori D, de Mutsert R, Nohr EA, Ohlsson C, Olsen J, Ong KK, Paternoster L, Pattie A, Penninx B, Perola M, Peyser PA, Pirastu M, Polasek O, Power C, Kaprio J, Raffel LJ, Räikkönen K, Raitakari O, Ridker PM, Ring SM, Roll K, Rudan I, Ruggiero D, Rujescu D, Salomaa V, Schlessinger D, Schmidt H, Schmidt R, Schupf N, Smit J, Sorice R, Spector TD, Starr JM, Stöckl D, Strauch K, Stumvoll M, Swertz MA, Thorsteinsdottir U, Thurik AR, Timpson NJ, Tung JY, Uitterlinden AG, Vaccargiu S, Viikari J, Vitart V, Völzke H, Vollenweider P, Vuckovic D, Waage J, Wagner GG, Wang JJ, Wareham NJ, Weir DR, Willemsen G, Willeit J, Wright AF, Zondervan KT, Stefansson K, Krueger RF, Lee JJ, Benjamin DJ, Cesarini D, Koellinger PD, den Hoed M, Snieder H, Mills MC, BIOS Consortium. LifeLines Cohort Study Genome-wide analysis identifies 12 loci influencing human reproductive behavior. Nature Genetics. 2016;48:1462–1472. doi: 10.1038/ng.3698. - DOI - PMC - PubMed
    1. Bates D, Mächler M, Bolker B, Walker S. Fitting linear mixed-effects models using lme4. Journal of Statistical Software. 2015;67:1–48. doi: 10.18637/jss.v067.i01. - DOI

Associated data

LinkOut - more resources