. 2025 Sep 9;122(36):e2424009122.
doi: 10.1073/pnas.2424009122. Epub 2025 Sep 2.

AhR signaling in skin-resident CD207+ cells is involved in UV-B-induced amelioration of neuroinflammation

Affiliations

AhR signaling in skin-resident CD207+ cells is involved in UV-B-induced amelioration of neuroinflammation

Nadine Mykicki et al. Proc Natl Acad Sci U S A. .

Abstract

Environmental stimuli, including the exposure to ultraviolet (UV)-B light, are known to play a role in the modulation of immune-mediated mechanisms in multiple sclerosis (MS). In experimental autoimmune encephalomyelitis (EAE), we have shown that UV-B irradiation ameliorates disease outcome by regulatory T cells (Treg) expansion. Moreover, the UV-B-mediated induction of Treg numbers was also observed in MS. The aryl hydrocarbon receptor (AhR) can be activated by environmental factors including UV-B-induced photoproducts of tryptophan. Thus, we investigated the role of AhR during the transmission of UV-B irradiation. Therefore, wild-type (WT) and AhR-deficient mice (AhR-/-) were irradiated with UV-B light and immunized with myelin oligodendrocyte glycoprotein (MOG)-peptide. In WT mice it was shown that UV-B irradiation reduces EAE symptoms by Treg expansion. This effect was abrogated in animals with AhR deficiency. To better understand the underlying mechanisms of AhR regulation, we used mice with a deletion of AhR specifically in different subsets of antigen-presenting cells (APC) that have been shown to mediate the expansion of Treg. Interestingly, we could show that the AhR activation in murine cutaneous APC was sufficient to switch APC from a stimulatory into a regulatory phenotype, and moreover, responsible for APC cell maturation and migration into regional lymph nodes. Thus, our data indicate that AhR activation in APC might be required for UV-B-mediated immunosuppression during MOG-induced EAE. Hence, activation of AHR in tissue-resident APC, potentially by low-dose UV-B irradiation, might be beneficial as an adjuvant treatment in inflammatory or degenerative diseases of the central nervous system.

Keywords: UV-B; aryl hydrocarbon receptor; cutaneous dendritic cells; experimental autoimmune encephalomyelitis; multiple sclerosis.


Conflict of interest statement

Competing interests statement:The authors declare no competing interest.

Figures
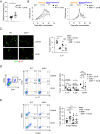
Fig. 1.
Fig. 1.
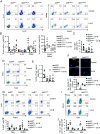
UV-B-induced amelioration of EAE is abrogated in the absence of AhR. Wild type (WT, n = 13 at disease maximum and n = 3 at reconvalescence phase) as well as AhR–/– [n = 18 (disease maximum) and n = 8 (reconvalescence)] mice were immunized with MOG peptide and irradiated with UV-B light as described in the Materials and Methods. Triangles indicate the days of irradiation. (A) Serum samples were collected from irradiated WT mice and untreated controls at disease maximum. Hepa 1.6 cells were transfected with the indicated luciferase reporter plasmids and stimulated with serum samples. One day later, relative units of luminescence were determined as an indication for AhR ligand activity in the serum. (B) Mean clinical scores are shown. (C) Immunofluorescence staining of murine brain tissue from UV-B irradiated and nonirradiated WT and AhR–/– mice at disease maximum. One representative image (Left) as well as the statistical evaluation from n = 4 mice out of three different experiments (Right) are shown. To evaluate TH17 numbers, cells were counted in nine visual fields of each cryosection. Original magnification 400×, (Scale bar, 20 µm.) (D) Flow cytometry of effector T cells in the CNS at disease maximum. Representative density plots (Left) and the statistical evaluation (Right) from n = 3 mice per group are shown. Cell subsets are gated for CD4+CD44+ T cells. (E) Flow cytometry of Treg in the CNS at disease maximum. Representative density plots (Left) and the statistical evaluation from n ≥ 9 mice per group (Right) are shown. *P < 0.05 (Mann–Whitney U test for A and B; One-way ANOVA for CE. P-value was adjusted with Dunnett’s test for multiple comparisons). The data are shown as the means ± SEMs.
Fig. 2.
Fig. 2.
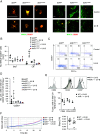
AhR activation in CD11c+ or CD207+ cutaneous APC is crucial for UV-B-induced amelioration of EAE. AhRfl/fl (n = 11 at disease maximum)/n = 4 at reconvalescence), AhRΔCD11c (n = 10 at disease maximum/ n = 3 at reconvalescence) as well as AhRΔCD207 (n = 11 at disease maximum, n = 3 at reconvalescence) mice were immunized with MOG peptide and irradiated with UV-B light as described in the Materials and Methods. Triangles indicate the days of irradiation. (A) Mean clinical scores are shown. (B) Representative H&E as well as LFB staining in lumbal spinal cord at disease maximum as well as statistical analyses of inflammatory foci and demyelinated areas from n ≥ 3 mice from three different experiments are shown. Original magnification 100×, (Scale bar, 200 µm.) Infiltration of mononuclear cells and demyelinated areas are indicated by arrows. (C) Immunofluorescence staining of murine brain tissue from UV-B irradiated and nonirradiated AhRfl/fl, AhRΔCD11c, and AhRΔCD207 mice at disease maximum using antibodies against CD4 (green) and IL-17A (red). One representative image (Left) as well as the statistical evaluation from n ≥ 3 mice out of three different experiments (Right) are shown. To evaluate TH17 numbers, cells were counted in nine visual fields of each cryosection. Original magnification 400×, (Scale bar, 20 µm.) *P < 0.05 (Mann–Whitney U test for A; One-way ANOVA for B and C. P-value was adjusted with Tukey’s (B) or Sidak’s (C) test for multiple comparisons). The data are shown as the means ± SEMs.
Fig. 3.
Fig. 3.
UV-B light fails to induce immunosuppressive immune cells in AhRΔCD11c and AhRΔCD207 mice. (A and B) Flow cytometry of pathogenic T cells (Left) and Treg (Right) in the CNS at disease maximum. Representative density plots (A) and statistics (B) from n ≥ 3 mice per group are shown; IL-17+ and IL-22+ cells were gated for CD4+CD44+ T cells. (C) Flow cytometry of total CD4+ T cells in the CNS at disease maximum. Statistics from n ≥ 7 mice per group are shown. (D and E) Flow cytometry of TH1 cells in the CNS at disease maximum. Representative density plots (D) and statistics (E) from n ≥ 6 mice per group are shown; IFN-γ+ and T-bet+ cells were gated for CD4+CD44+ T cells. (F) Immunofluorescence staining of murine brain tissue from UV-B irradiated and nonirradiated AhRfl/fl and AhRΔAPC mice at disease maximum using antibodies against CD4 (blue), IL-17A (red), and GM-CSF (green). One representative image and statistics (below) from n = 4 mice are shown. To evaluate CD4+IL-17+GM-CSF+ cell numbers, cells were counted in 12 visual fields of each cryosection. Original magnification 400×, (Scale bar, 20 µm.) (*P < 0.05 versus nonirradiated controls tested with One-way ANOVA. P-value was adjusted with Tukey’s test for multiple comparisons). (G and H) Flow cytometry to quantify AhR expression in Treg or CD207+ APC in skin draining lymph nodes at the disease maximum. Representative density plots (G) and the statistical evaluation from n ≥ 4 mice per group (H) are shown. (I and J) Flow cytometry showing PD-L1 and IDO suppressing MHC+CD11c+ cells in skin draining lymph nodes at the disease maximum. Representative density plots (I) and the statistical evaluation from n ≥ 3 mice per group (J) are shown. *P < 0.05 versus nonirradiated controls tested with One-way ANOVA for B, C, E, H, and J. P-value was adjusted with Dunnett’s test for multiple comparisons.
Fig. 4.
Fig. 4.
Langerin+ cell maturation and migration are impaired in AhR-deficient mice. (A and B) Immunofluorescence staining of murine epidermal sheets (Left) as well as from skin draining lymph nodes (Right) from UV-B irradiated and nonirradiated AhRfl/fl, AhRΔCD11c, and AhRΔCD207 mice at disease maximum. One representative image (A) as well as the statistical evaluation (B) from n ≥ 3 mice as of three different experiments are shown. To evaluate cell numbers, cells were counted in five visual fields of each cryosection. Original magnification 400×, (Scale bar, 20 µm.) (C) Flow cytometry of CD207+ cells in skin draining lymph nodes at disease maximum. Representative density plots and statistics (D) from n = 3 mice per group are shown; cells are gated for LinMHCII+CD11c+CD11b+Sirpα+. (E) Flow cytometry of costimulatory molecules in BM-DC of WT (black curve) and AhR−/− (gray curve) mice after UV-B stimulation. Representative Overlay (Top) and statistics (Bottom) from n ≥ 3 mice per group are shown; cells are gated for LinMHCII+CD11c+. (F) Migration assay of UV-B-irradiated BM-DC of WT versus AhR−/− mice. Cells were cultured in the presence of GM-CSF and IL-4 and stimulated with 1.25 mJ/cm2 UV-B. Cells were seeded on a CIM plate coated with 10 μg/mL bovine Collagen-I. Cell migration was measured as change of impedance and read out as Delta cell index. Migration rates are measured as slopes of delta cell index values over a time period (marked by blue and red vertical lines in (F). Representative migration of BM-DC of 2 WT and AhR−/− mice (Left) as well as statistics (Right) during 5 h of measurement from n = 3 mice and 14 to 15 replicates are represented. *P < 0.05 (Student’s t test for E; Mann–Whitney U test for F; One-way ANOVA for B, D, and E. P-value was adjusted with Dunnett’s test for multiple comparisons). The data are shown as the means ± SEMs.
Fig. 5.
Fig. 5.
AhR upregulation in CD207+ cells in MS patients after 6 wk of UV-B irradiation. (A and B) Immunofluorescence staining of human skin from MS patients before (T0) and 6 wk after phototherapy (T6). Three representative images (A) as well as the statistical evaluation (B) from n = 6 individuals are shown. To evaluate the numbers of total CD207+ and AhR+CD207+ cells, cells were counted in six visible fields of each cryosection. Original magnification 200×, (Scale bar, 20 µm.)

References

    1. Breuer J., et al. , Ultraviolet B light attenuates the systemic immune response in central nervous system autoimmunity. Ann. Neurol. 75, 739–758 (2014). - PubMed
    1. Lincoln J. A., Cook S. D., An overview of gene-epigenetic-environmental contributions to MS causation. J. Neurol. Sci. 286, 54–57 (2009). - PubMed
    1. Jacob A., et al. , Aryl hydrocarbon receptor-dependent upregulation of Cyp1b1 by TCDD and diesel exhaust particles in rat brain microvessels. Fluids Barriers CNS 8, 23 (2011). - PMC - PubMed
    1. Hanieh H., Toward understanding the role of aryl hydrocarbon receptor in the immune system: Current progress and future trends. Biomed. Res. Int. 2014, 520763 (2014). - PMC - PubMed
    1. Oberg M., Bergander L., Håkansson H., Rannug U., Rannug A., Identification of the tryptophan photoproduct 6-formylindolo[3, 2-b]carbazole, in cell culture medium, as a factor that controls the background aryl hydrocarbon receptor activity. Toxicol. Sci. 85, 935–943 (2005). - PubMed

MeSH terms

Substances

LinkOut - more resources