

Proximity to a hazardous waste thermal treatment facility alters human physiology: a community-driven pilot study
- PMID: 40893144
- PMCID: PMC12394085
- DOI: 10.3389/ebm.2025.10655
Proximity to a hazardous waste thermal treatment facility alters human physiology: a community-driven pilot study
Abstract
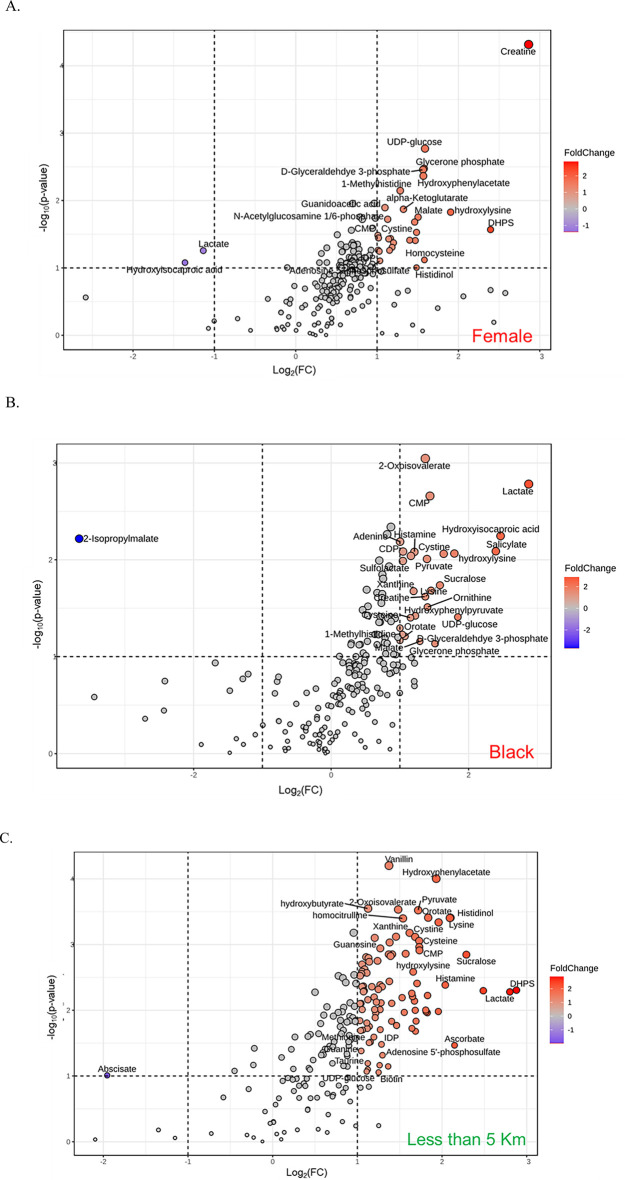
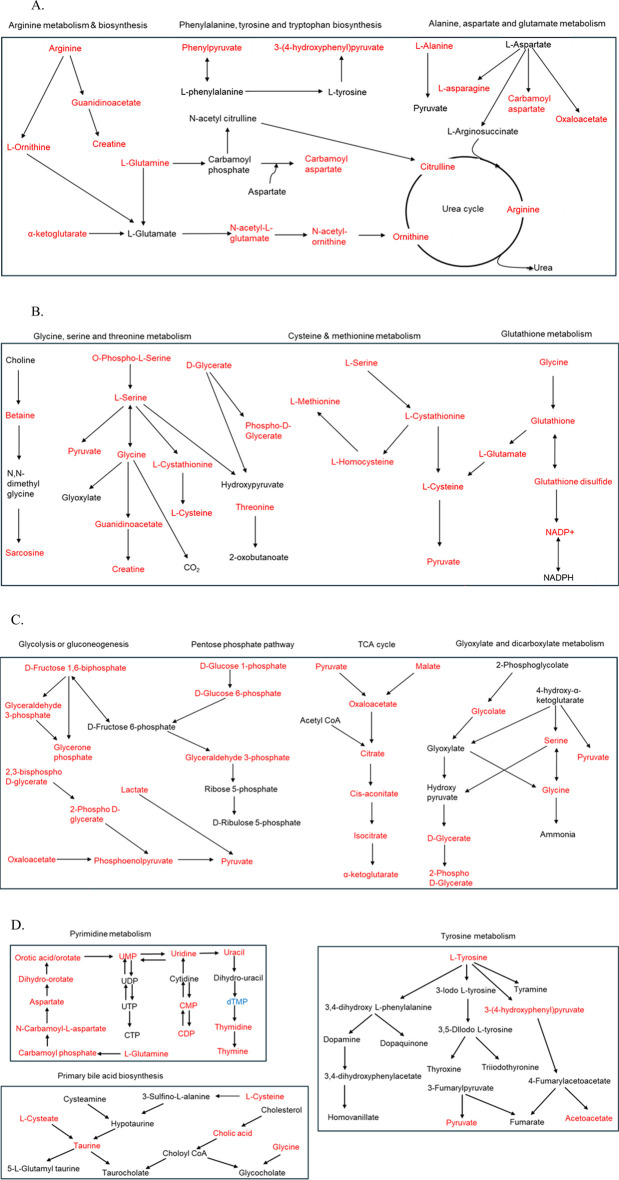
Open burn/open detonation (OB/OD) disposes of explosive waste via uncontrolled combustion, releasing harmful pollutants like toxic gases and particulate matter. Colfax, Louisiana, houses the nation's only commercially OB/OD thermal treatment (TT) facility, raising concerns about environmental and public health impacts due to its emissions. In this exploratory pilot study, we investigated metabolic alterations indicative of potential health impacts from exposure to emissions from a TT facility through an untargeted metabolomics analysis of urine samples obtained from local residents. Urine samples were collected from 51 residents living within a 30-km radius of the facility, with proximity, race, and sex as key variables. Samples were analyzed using ultra-high-performance liquid chromatography coupled with high-resolution mass spectrometry (UHPLC-HRMS) to identify metabolic alterations and potential biomarkers of exposure. A total of 217 metabolites were identified, with significant differences in abundance based on proximity to the facility. Key metabolic pathways affected included energy metabolism, amino acid metabolism, and oxidative stress-related pathways. Metabolites associated with oxidative stress, such as glutathione sulfonamide (GSA), were elevated in individuals residing closer to the facility, indicating increased oxidative stress. Alterations in the glutathione/glutathione disulfide (GSH/GSSG) ratio further highlighted redox imbalances. Pathway enrichment analyses revealed perturbations in glycolysis, citric acid cycle, sulfur metabolism, and nucleotide metabolism, which are linked to critical biological functions like energy production and DNA repair. Notable differences in metabolite profiles were also observed between sexes and racial groups, pointing to the interplay of intrinsic biological and environmental factors. These findings demonstrate that exposure to emissions from the TT facility may have significant impacts on human health, including disruptions in cellular metabolism and increased oxidative stress. Further research is crucial to understand the long-term health implications of these metabolic alterations and to develop strategies to mitigate the environmental and health risks associated with this facility.
Keywords: environmental exposure; hazard waste remediation; metabolomics; open burn; oxidative stress.
Copyright © 2025 Kumar, Guo, Sarumi, Courtney, Campagna, Richmond-Bryant and Cormier.
Conflict of interest statement
The author(s) declared no potential conflicts of interest with respect to the research, authorship, and/or publication of this article.
Figures


Similar articles
-
Prescription of Controlled Substances: Benefits and Risks.2025 Jul 6. In: StatPearls [Internet]. Treasure Island (FL): StatPearls Publishing; 2025 Jan–. 2025 Jul 6. In: StatPearls [Internet]. Treasure Island (FL): StatPearls Publishing; 2025 Jan–. PMID: 30726003 Free Books & Documents.
-
Can a Liquid Biopsy Detect Circulating Tumor DNA With Low-passage Whole-genome Sequencing in Patients With a Sarcoma? A Pilot Evaluation.Clin Orthop Relat Res. 2025 Jan 1;483(1):39-48. doi: 10.1097/CORR.0000000000003161. Epub 2024 Jun 21. Clin Orthop Relat Res. 2025. PMID: 38905450
-
Sexual Harassment and Prevention Training.2024 Mar 29. In: StatPearls [Internet]. Treasure Island (FL): StatPearls Publishing; 2025 Jan–. 2024 Mar 29. In: StatPearls [Internet]. Treasure Island (FL): StatPearls Publishing; 2025 Jan–. PMID: 36508513 Free Books & Documents.
-
Housing improvements for health and associated socio-economic outcomes.Cochrane Database Syst Rev. 2013 Feb 28;(2):CD008657. doi: 10.1002/14651858.CD008657.pub2. Cochrane Database Syst Rev. 2013. PMID: 23450585
-
Antioxidants for male subfertility.Cochrane Database Syst Rev. 2014;(12):CD007411. doi: 10.1002/14651858.CD007411.pub3. Epub 2014 Dec 15. Cochrane Database Syst Rev. 2014. Update in: Cochrane Database Syst Rev. 2019 Mar 14;3:CD007411. doi: 10.1002/14651858.CD007411.pub4. PMID: 25504418 Updated.
References
-
- U.S. Census Bureau. S0601: selected characteristics of the total and native populations in the United States. 5-year Am Community Surv Colfax town, La (2023). Available online at: https://data.census.gov/table/ACSST5Y2023.S0601?q=colfax,%20la (Accessed December 27, 2024).
-
- U.S. Census Bureau. S0601: selected characteristics of the total and native populations in the United States. 2023 5-year American Community Survey, Grant Parish, Louisiana; (2025). Available online at: https://data.census.gov/table/ACSST5Y2023.S0601?q=grant+parish+la (Accessed March 26, 2025).
-
- Louisiana Department of Environmental Quality (LDEQ). Hazardous waste permit application R&D, 1 (2024). Available online at: https://edms.deq.louisiana.gov/app/doc/view?doc=673338 (Accessed July 1, 2024).
-
- U.S. EPA. Supplement to the 2019 integrated science assessment for particulate matter. Final Report; (2022). United states environmental protection agency. EPA/635/R-22/028, 2022. - PubMed
MeSH terms
Substances
LinkOut - more resources
Full Text Sources
Miscellaneous