. 2025 Aug 11;10(33):37025-37038.
doi: 10.1021/acsomega.5c00572. eCollection 2025 Aug 26.

Selective Green Colorimetric Liquid- and Solid-Based Determination of Furfural in Power Transformer Insulating Fluid

Affiliations

Selective Green Colorimetric Liquid- and Solid-Based Determination of Furfural in Power Transformer Insulating Fluid

Eunyoung Kim et al. ACS Omega. .

Abstract

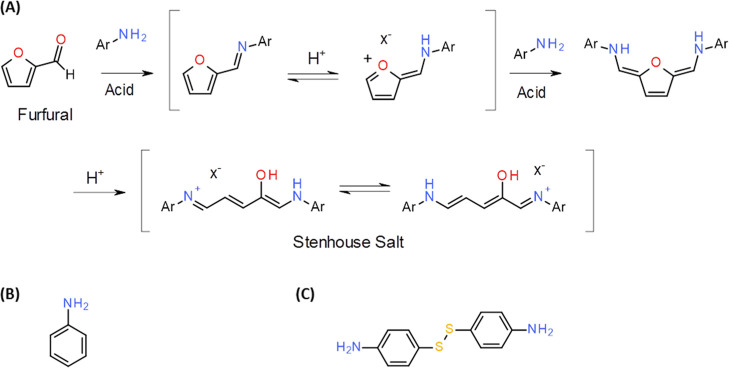
Furfural (FF), an intermediate aldehyde compound, can serve as an indicator of the extent of the Maillard reaction on heat-induced food processing and storage, as well as for the aging assessment of the solid insulation of oil-immersed transformers because it is formed by the degradation of cellulosic insulation. By considering the concepts of green analytical chemistry, a new furfural-bis-(4-aminophenyl) disulfide (APDS) colorimetric chemosensory assay, based on the Stenhouse reaction between furfural and APDS, was developed for the quantification of furfural by utilizing UV spectroscopy and colorimetric analyses. A strong correlation between UV-vis absorbance and furfural concentrations was observed, which confirmed the high sensitivity (0.00024 mM furfural) of the reaction system. The color change at 0.005 mM of furfural was noted by the naked eye. This was a unique and highly selective phenomenon because only furfural shows UV absorbance and color change within 450-600 nm of UV radiation, unlike other aromatic and aliphatic aldehydes. The highly sensitive method was applied for the qualification of 0-0.01 mM (0-1 ppm) of furfural in the power transformer insulating fluid. An APDS strip formulated with polyethylene glycol was used as the chromatography paper. This study demonstrates the successful surface Stenhouse coupling between furfural and APDS, as confirmed by X-ray photoelectron spectroscopy analysis. Therefore, this liquid- and solid-based assay is a novel, green analytical method as it uses safer solid APDS instead of toxic liquid aniline that is generally used in conventional methods. In addition, the method is simpler, which makes the on-site analysis possible.


Figures

1
1. (A) Formation of Stenhouse Salts from Aniline and Furfural (Ar = Ph from Aniline, X = Counter Ion (−) from Acid); , (B) Aniline; (C) Bis­(4-Aminophenyl) Disulfide (APDS)
1
1
UV–vis spectrum. (A) AA, 10 ppm furfural (FF), and 10 and 50 mM APDS in AA. (B) 50 mM APDS in AA, 20 ppm FF, and 50 mM APDS in AA, propionic acid, valeric acid, and 0.031 M HCl. (C) UV spectrum and (D) absorption at 550 nm on the reaction of 150 μL of 10 ppm FF and 150 μL of 10 mM APDS solution in AA in a 10 × 10 mm quartz cell in the reaction time course. (C,D) Share the same experimental conditions, with (C) displaying the full UV spectrum and (D) highlighting the specific absorption at 550 nm.
2
2
Effect of (A) solvent, (B) ethanol concentration, and (C) water addition on the reaction of 100 μL of 10 ppm furfural and 100 μL of 10 mM APDS solution in a 96-well plate in the reaction time course. Water was added at 1, 5, and 10 min and compared the reaction solution without water. UV–vis absorption at 550 nm.
3
3
(A) Linear correlation between UV absorbance at 550 nm and furfural concentrations and (B) colorimetric responses obtained from the reaction of furfural (0–0.5 mM) and APDS (50 mM) prepared in a mixture of 70% AA and 30% ethanol. (a) Reaction of furfural (100 μL) and APDS (50 μL). (b) Reaction of furfural (100 μL) and APDS (100 μL). (c) Reaction of furfural (200 μL) and APDS (100 μL). The insert plate indicates the linear correlation in low furfural concentration (0–0.01 mM).
4
4
UV–vis spectrum of (A) aldehyde–APDS reaction solutions obtained from the reaction of aliphatic aldehydes (0.2 mM of formaldehyde (FA), butanal (BA), and pentanal (PA)) and aromatic aldehydes (0.02 mM of furfural), 5-hydroxymethylfurfural (5-HMF), benzaldehyde (BzA), 4-hydroxy-benzaldehyde (4-H-benzaldehyde, 4HBzA), and vanillin (VA) with 50 mM of APDS. (B) Color development and comparison of the resection solution of 0.2 mM of aldehydes and 50 mM of APDS at 10 min in a 96-well plate. Aldehydes and APDS solution were prepared in a mixture of 70% AA and 30% ethanol.
5
5
(A) UV–vis spectrum. (B) Color development of furfural–APDS reaction solutions through an in situ extraction of 0–0.01 mM of model furfural in a power transformer insulating fluid with APDS (50 mM). In situ extraction and reaction were performed at a ratio of 4/1 (v/v, fluid/APDS solution). (C) Linear correlation of absorbance at 550 nm and furfural concentration in furfural standard solution and model insulating fluid. (D) Recovery of furfural extracted from the model insulating fluid.
6
6
Colorimetric responses on (A1) APDS strip and (A2) correlation between the diffuse reflectance value and furfural concentration prepared at 0, 0.01, 0.05, 0.1, and 0.2 mM in solution of 70% AA and 30% ethanol. Colorimetric responses on (B1) APDS strip and (B2) correlation between the diffuse reflectance value and furfural concentration extracted from the furfural model solution at 0, 0.001, 0.0025, 0.005, and 0.01 mM in the power transformer insulating fluid. The extraction was performed at the 10:1 ratio (oil: solution of 70% AA and 30% ethanol).
7
7
Relative standard deviation (RSD %) of diffuse reflectance analysis for (A) furfural concentration prepared at 0, 0.01, 0.05, 0.1, and 0.2 mM in a solution comprising 70% AA and 30% ethanol and (B) furfural concentration extracted from a furfural model solution at 0, 0.001, 0.0025, 0.005, and 0.01 mM in a power transformer insulating fluid calculated from the standard deviation.
8
8
XPS spectra of APDS: (A) C 1s spectrum; (B) enlarged view of panel (A); (C) S 2p region; (D) N 1s spectrum; (E) enlarged view of panel (D).
9
9
XPS spectra of APDS strips after the Stenhouse reaction. APDS strips were immersed in a solution of 10 mM furfural in 30 mM HCl. (A) C 1s spectrum; (B) enlarged view of panel (A); (C) S 2p region; (D) N 1s spectrum; (E) enlarged view of panel (D).

References

    1. Anastas P. T.. Green chemistry and the role of analytical methodology development. Crit. Rev. Anal. Chem. 1999;29:167–175. doi: 10.1080/10408349891199356. - DOI
    1. Gałuszka A., Migaszewski Z., Namieśnik J.. The 12 principles of green analytical chemistry and the SIGNIFICANCE mnemonic of green analytical practices. TrAC, Trends Anal. Chem. 2013;50:78–84. doi: 10.1016/j.trac.2013.04.010. - DOI
    1. Rico-Yuste A., González-Vallejo V., Benito-Peña E., De las Casas Engel T., Orellana G., Moreno-Bondi M. C.. Furfural determination with disposable polymer films and smartphone-based colorimetry for beer freshness assessment. Anal. Chem. 2016;88:3959–3966. doi: 10.1021/acs.analchem.6b00167. - DOI - PubMed
    1. Cepeda-Vázquez M., Blumenthal D., Camel V., Rega B.. Multivariate optimization of headspace trap for furan and furfural simultaneous determination in sponge cake. Talanta. 2017;164:708–715. doi: 10.1016/j.talanta.2016.10.073. - DOI - PubMed
    1. Xing Q., Ma Y., Fu X., Cao Q., Zhang Y., You C.. Effects of heat treatment, homogenization pressure, and overprocessing on the content of furfural compounds in liquid milk. J. Sci. Food Agric. 2020;100:5276–5282. doi: 10.1002/jsfa.10578. - DOI - PubMed

LinkOut - more resources