. 2025 Aug;15(8):4014-4029.
doi: 10.1016/j.apsb.2025.06.005. Epub 2025 Jun 9.

The protein arginine methyltransferase PRMT1 ameliorates cerebral ischemia-reperfusion injury by suppressing RIPK1-mediated necroptosis and apoptosis

Affiliations

The protein arginine methyltransferase PRMT1 ameliorates cerebral ischemia-reperfusion injury by suppressing RIPK1-mediated necroptosis and apoptosis

Tengfei Liu et al. Acta Pharm Sin B. 2025 Aug.

Abstract

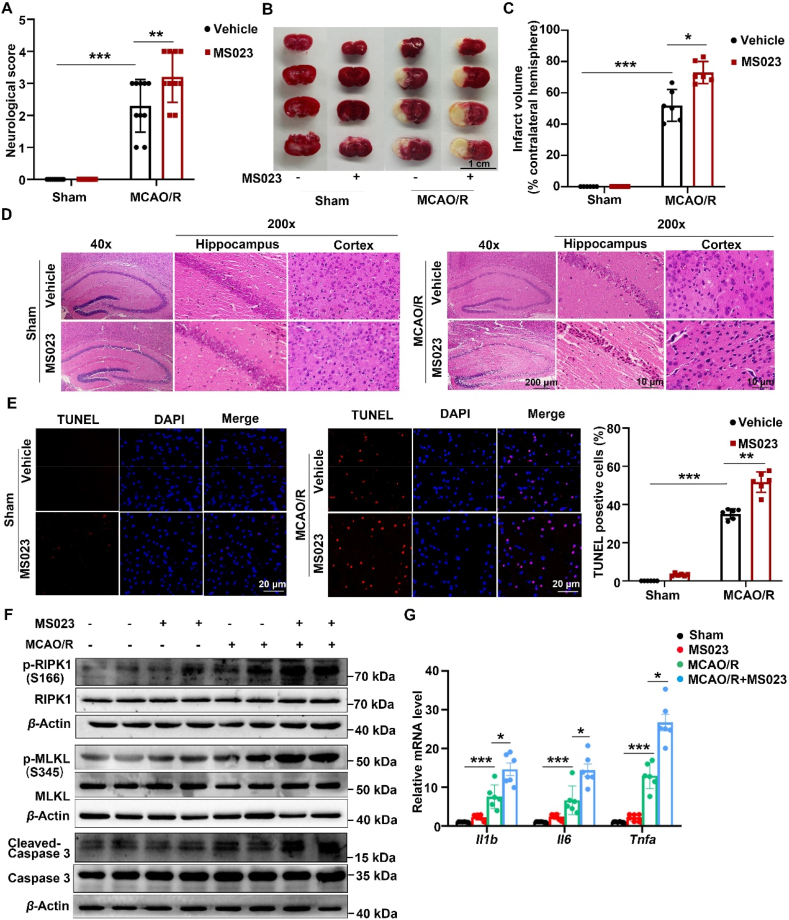
Receptor-interacting protein kinase 1 (RIPK1) plays an essential role in regulating the necroptosis and apoptosis in cerebral ischemia-reperfusion (I/R) injury. However, the regulation of RIPK1 kinase activity after cerebral I/R injury remains largely unknown. In this study, we found the downregulation of protein arginine methyltransferase 1 (PRMT1) was induced by cerebral I/R injury, which negatively correlated with the activation of RIPK1. Mechanistically, we proved that PRMT1 directly interacted with RIPK1 and catalyzed its asymmetric dimethylarginine, which then blocked RIPK1 homodimerization and suppressed its kinase activity. Moreover, pharmacological inhibition or genetic ablation of PRMT1 aggravated I/R injury by promoting RIPK1-mediated necroptosis and apoptosis, while PRMT1 overexpression protected against I/R injury by suppressing RIPK1 activation. Our findings revealed the molecular regulation of RIPK1 activation and demonstrated PRMT1 would be a potential therapeutic target for the treatment of ischemic stroke.

Keywords: Apoptosis; Arginine methylation; Cerebral ischemia–reperfusion injury; MLKL; Necroptosis; PRMT1; Phosphorylation; RIPK1.


Conflict of interest statement

The authors declare no competing interests.

Figures

Image 1
Graphical abstract
Figure 1
Figure 1
The protein level of PRMT1 was downregulated after cerebral I/R injury, which negatively correlated with p-RIPK1(S166). (A) Western blot analysis of the total ADMA, SDMA, and MMA in brain tissues from wild-type (WT) mice subjected to middle cerebral artery occlusion (MCAO) for 2 h and reperfusion for 24 h. (B) Western blot analysis of the total ADMA in PC12 cells subjected to OGD/R. Western blot analysis of PRMT1 (C), p-RIPK1 (S166), and RIPK1 (E) in brain tissues from WT mice after MCAO for 2 h and reperfusion for 3, 6, 12, 24, and 48 h, n = 6 mice per group. (D) Double immunofluorescence of PRMT1 (green) and NeuN (neuron marker, red) was performed in mouse ischemic cortex after 2 h MCAO and 12 h reperfusion. Scale bar, 20 μm. Western blot analysis of PRMT1 (G), RIPK1, and p-RIPK1 (S166) (H) in PC12 cells subjected to OGD for 3 h and reoxygenation for 1, 3, 6, 12, and 24 h. (F, I) Pearson correlation analyses showing the correlations between PRMT1 and p-RIPK1 (S166) expression in the brain of WT mice subjected to MCAO/R (F) or PC12 cells subjected to OGD/R (I), P < 0.01 for all of these correlations. (J) Western blot analysis of PRMT1, p-RIPK1 (S166), and RIPK1 in PC12 cells transfected with siPRMT1 or negative control. (K) Western blot analysis of GFP-PRMT1, p-RIPK1 (S166), and RIPK1 in HEK 293T cells transfected with GFP-PRMT1 plasmid or empty vector. Results are representative of 4 independent experiments. Data are presented as mean ± SD. Multiple comparisons were evaluated by one-way ANOVA (C, E, G, H) followed by Tukey's test. ∗P < 0.05, ∗∗P < 0.01 compared with control group.
Figure 2
Figure 2
MS023, an inhibitor of type I protein arginine methyltransferase (PRMT), enhanced necroptosis and apoptosis of PC12 cells after OGD/R. PC12 cells were subjected to OGD for 3 h and reoxygenation for 24 h, 5 μmol/L MS023 or vehicle was administered during reoxygenation. TUNEL assay (A), flow cytometry analysis (B) and the protein levels of cleaved-caspase 3 and caspase 3 (E) were assessed. Western blot analysis of p-RIPK1 (S166) and RIPK1 (C), p-MLKL (S345) and MLKL (D) was determined in PC12 cells subjected to 3 h OGD and 6 h reoxygenation with MS023 treatment. Scale bars, 20 μm. Results are representative of 3 or 4 independent experiments. All data are shown as mean ± SD. Multiple comparisons were evaluated by two-way ANOVA followed by Tukey's test, ∗P < 0.05, ∗∗P < 0.01 compared with the indicated group.
Figure 3
Figure 3
PRMT1 silence exacerbated RIPK1-mediated necroptosis and apoptosis of PC12 cells induced by OGD/R. PC12 cells transfected with siPRMT1 or NC were subjected to OGD for 3 h and reoxygenation for 24 h. In rescue experiments, PC12 cells were treated with 10 μmol/L Nec-1 during siPRMT1 transfection and OGD/R process. Flow cytometry analysis (A), PI staining (I), cell viability (H), and the protein levels of cleaved-caspase 3 and caspase 3 (D, G) were assessed. p-RIPK1 (S166) and RIPK1 (B, E), p-MLKL (S345) and MLKL (C, F) in PC12 cells subjected to 3 h of OGD and 6 h of reoxygenation were determined by Western blot. Results are representative of 3 or 4 independent experiments. All data are shown as mean ± SD. Multiple comparisons were evaluated by two-way ANOVA followed by Tukey's test, ∗P < 0.05, ∗∗P < 0.01, ∗∗∗P < 0.001 compared with the indicated group.
Figure 4
Figure 4
PRMT1 protected PC12 cells against OGD/R injury by inhibiting necroptosis and apoptosis. PC12 cells transfected with Flag-PRMT1 or empty vector (EV) were subjected to OGD for 3 h and reoxygenation for 24 h. TUNEL assay (A), flow cytometry analysis of Annexin V and PI (B), and the protein levels of cleaved-caspase 3 and caspase 3 (E) were assessed. p-RIPK1 (S166) and RIPK1 (C), p-MLKL (S345) and MLKL (D) in PC12 cells subjected to 3 h of OGD and 6 h of reoxygenation were determined by Western blot. Scale bars, 20 μm. Results are representative of 3 or 4 independent experiments. All data are shown as mean ± SD. Multiple comparisons were evaluated by two-way ANOVA followed by Tukey's test, ∗P < 0.05, ∗∗P < 0.01, ∗∗∗P < 0.001 compared with the indicated group.
Figure 5
Figure 5
PRMT1 interacted with RIPK1 directly. (A, B) Co-IP analysis of the exogenous interaction of PRMT1 with RIPK1. HEK 293T cells were transfected with plasmids expressing GFP-PRMT1 and Flag-RIPK1. (C) Representative images of laser scanning confocal microscopy for GFP-PRMT1 (green) and Flag-RIPK1 (red) in HEK 293T cells. Scale bar, 5 μm. (D) Co-IP analysis of the endogenous interaction of PRMT1 with RIPK1 in PC12 cells subjected to 3 h of OGD and 6 h of reoxygenation. (E) Co-IP analysis of the interaction between recombinant protein Flag-PRMT1 and His-RIPK1 incubated in vitro.
Figure 6
Figure 6
PRMT1 inhibited RIPK1 auto-phosphorylation by promoting its methylation. (A) Western blot analysis of Flag-PRMT1, p-RIPK1 (S166), and RIPK1 in PC12 cells transfected with Flag-PRMT1 plasmid (WT or VLD-AAA). (B) Co-IP analysis of arginine methylation types (ADMA, SDMA, MMA) of RIPK1 in HEK 293T cells transfected with plasmids expressing Flag-RIPK1. (C) Co-IP analysis of the endogenous RIPK1 asymmetric dimethylation in PC12 cells subjected to 3 h of OGD and 6 h of reoxygenation. (D) IP analysis of the ADMA level of RIPK1 in PC12 cells treated with vehicle or MS023 for 24 h. (E) IP analysis of the ADMA level of RIPK1 in PC12 cells transfected with siPRMT1 or NC. (F) IP analysis of the ADMA level of RIPK1 in HEK 293T cells transfected with Flag-PRMT1 plasmid (WT or VLD-AAA) and Myc-RIPK1. (G) HEK 293T cells were transfected with Flag-RIPK1, Myc-RIPK1 and GFP-PRMT1 plasmids. The interaction between differently tagged proteins was determined by Co-IP analysis. (H) Representative images of laser scanning confocal microscopy for GFP (green) and Myc (red) in HEK 293T cells transfected with Myc-RIPK1 and GFP-PRMT1 or GFP-vector plasmids. Scale bar, 5 μm. (I) IP analysis of RIPK1 ubiquitination in HEK 293T cells transfected with plasmids expressing Flag-PRMT1, His-RIPK1, and HA-ubiquitin (HA-Ub). (J) IP analysis of the ADMA level of RIPK1 in HEK 293T cells transfected with plasmids expressing GFP-PRMT1, Myc-RIPK1WT, or corresponding mutants. (K) IP analysis of the phosphorylation level (Ser166) of RIPK1 in HEK 293T cells transfected with plasmids expressing GFP-PRMT1, Myc-RIPK1WT, or Myc-RIPK1R658K.
Figure 7
Figure 7
MS023 aggravated the cerebral I/R injury. Wild-type mice were subjected to MCAO for 2 h and reperfusion for 24 h. MS023 was intraventricularly administered to mice 30 min before MCAO. (A) Neurological deficit scores. n = 10 mice per group. (B) Representative photographs of coronal brain sections stained by TTC. Scale bar, 1 cm. (C) The infarct volume was expressed as the percentage of the contralateral hemispheric area. n = 6 mice per group. (D) Representative photomicrographs of H&E staining in the cortex and hippocampus. (E) Representative images and quantification of TUNEL staining in brain tissue. Scale bars, 20 μm. n = 6 mice per group. (F) Western blot analysis of p-RIPK1 (S166) and RIPK1, p-MLKL (S345) and MLKL, cleaved-caspase 3 and caspase 3 protein levels in I/R brain tissues. n = 6 mice per group. (G) The relative mRNA levels of Il1b, Il6, and Tnfa in brain tissues of mice subjected to ischemia–reperfusion injury. n = 6 mice per group. Results are shown as mean ± SD. Multiple comparisons were evaluated by two-way ANOVA followed by Tukey's test, ∗P < 0.05, ∗∗P < 0.01, ∗∗∗P < 0.001 compared with indicated group.
Figure 8
Figure 8
PRMT1 deficiency exacerbated the cerebral I/R injury. (A) Prmt1flox/flox mice were crossed with Thy1-Cre mice to generate Prmt1flox/floxThy1-Cre mice. (B) Genotyping was confirmed by tail preparation and PCR at 3 weeks of age. (C) Neurological deficit scores. n = 10 mice per group. (D) Representative photographs of coronal brain sections stained by TTC. Scale bar, 1 cm. (E) The infarct volume was expressed as the percentage of the contralateral hemispheric area. n = 6 mice per group. (F) Representative images and quantification of TUNEL staining in brain tissue. Scale bars, 20 μm. n = 6 mice per group. (G–I) Western blot analysis of p-RIPK1 (S166) and RIPK1 (G), p-MLKL (S345) and MLKL (H), cleaved-caspase 3 and caspase 3 (I) protein levels in I/R brain tissues. n = 6 mice per group. Results are shown as mean ± SD. Multiple comparisons were evaluated by two-way ANOVA followed by Tukey's test, ∗P < 0.05, ∗∗P < 0.01, ∗∗∗P < 0.001 compared with the indicated group.
Figure 9
Figure 9
Overexpression of PRMT1 by AAV-PRMT1 injection ameliorated the cerebral I/R injury. Adeno-associated virus (AAV) containing PRMT1 (AAV-PRMT1) was injected into the left brain of WT mice for 3 weeks. Then the mice were subjected to MCAO for 2 h and reperfusion for 24 h. (A) The injection coordinates. The AAV-PRMT1 efficiently infected mouse brain (B) and the protein expression of PRMT1 (C) was elevated in the AAV-PRMT1-injected mice. (D) Corner test results of indicated mice subjected to MCAO/R or sham treatment in the left section of the brain. n = 6 mice per group. (E) Neurological deficit scores. n = 10 mice per group. (F) Representative photographs of coronal brain sections stained by TTC. Scale bars, 1 cm. (G) The infarct volume was expressed as the percentage of the contralateral hemispheric area. n = 6 mice per group. (H) Representative photomicrographs of H&E staining in the cortex and hippocampus. Scale bars, 20 μm. (I) Representative images and quantification of TUNEL assay in brain tissue. Scale bars, 20 μm. n = 6 mice per group. (J) Western blot analysis of p-RIPK1 (S166), RIPK1, p-MLKL (S345), MLKL, cleaved-caspase 3 and caspase 3 protein levels in I/R brain tissues. n = 6 mice per group. (K) The relative mRNA levels of Il1b, Il6 and Tnfa in brain tissues of mice subjected to I/R injury. n = 6 mice per group. Results are shown as mean ± SD, multiple comparisons were evaluated by two-way ANOVA followed by Tukey's test, ∗P < 0.05, ∗∗P < 0.01, ∗∗∗P < 0.001 compared with the indicated group.

References

    1. Iadecola C., Buckwalter M.S., Anrather J. Immune responses to stroke: mechanisms, modulation, and therapeutic potential. J Clin Investig. 2020;130:2777–2788. - PMC - PubMed
    1. Iadecola C., Anrather J. Stroke research at a crossroad: asking the brain for directions. Nat Neurosci. 2011;14:1363–1368. - PMC - PubMed
    1. Gorelick P.B. The global burden of stroke: persistent and disabling. Lancet Neurol. 2019;18:417–418. - PubMed
    1. Tsivgoulis G., Saqqur M., Sharma V.K., Brunser A., Eggers J., Mikulik R., et al. Timing of recanalization and functional recovery in acute ischemic stroke. J Stroke. 2020;22:130–140. - PMC - PubMed
    1. Wang Q., Yang F., Duo K., Liu Y., Yu J., Wu Q., et al. The role of necroptosis in cerebral ischemic stroke. Mol Neurobiol. 2024;61:3882–3898. - PubMed

LinkOut - more resources