. 2025;7(3):74-97.
doi: 10.33696/immunology.7.227.

Inflammatory, Functional, and Compositional Changes of the Uterine Immune Microenvironment in a Lymphangioleiomyomatosis Mouse Model

Affiliations

Inflammatory, Functional, and Compositional Changes of the Uterine Immune Microenvironment in a Lymphangioleiomyomatosis Mouse Model

Danielle S Stiene et al. J Cell Immunol. 2025.

Abstract

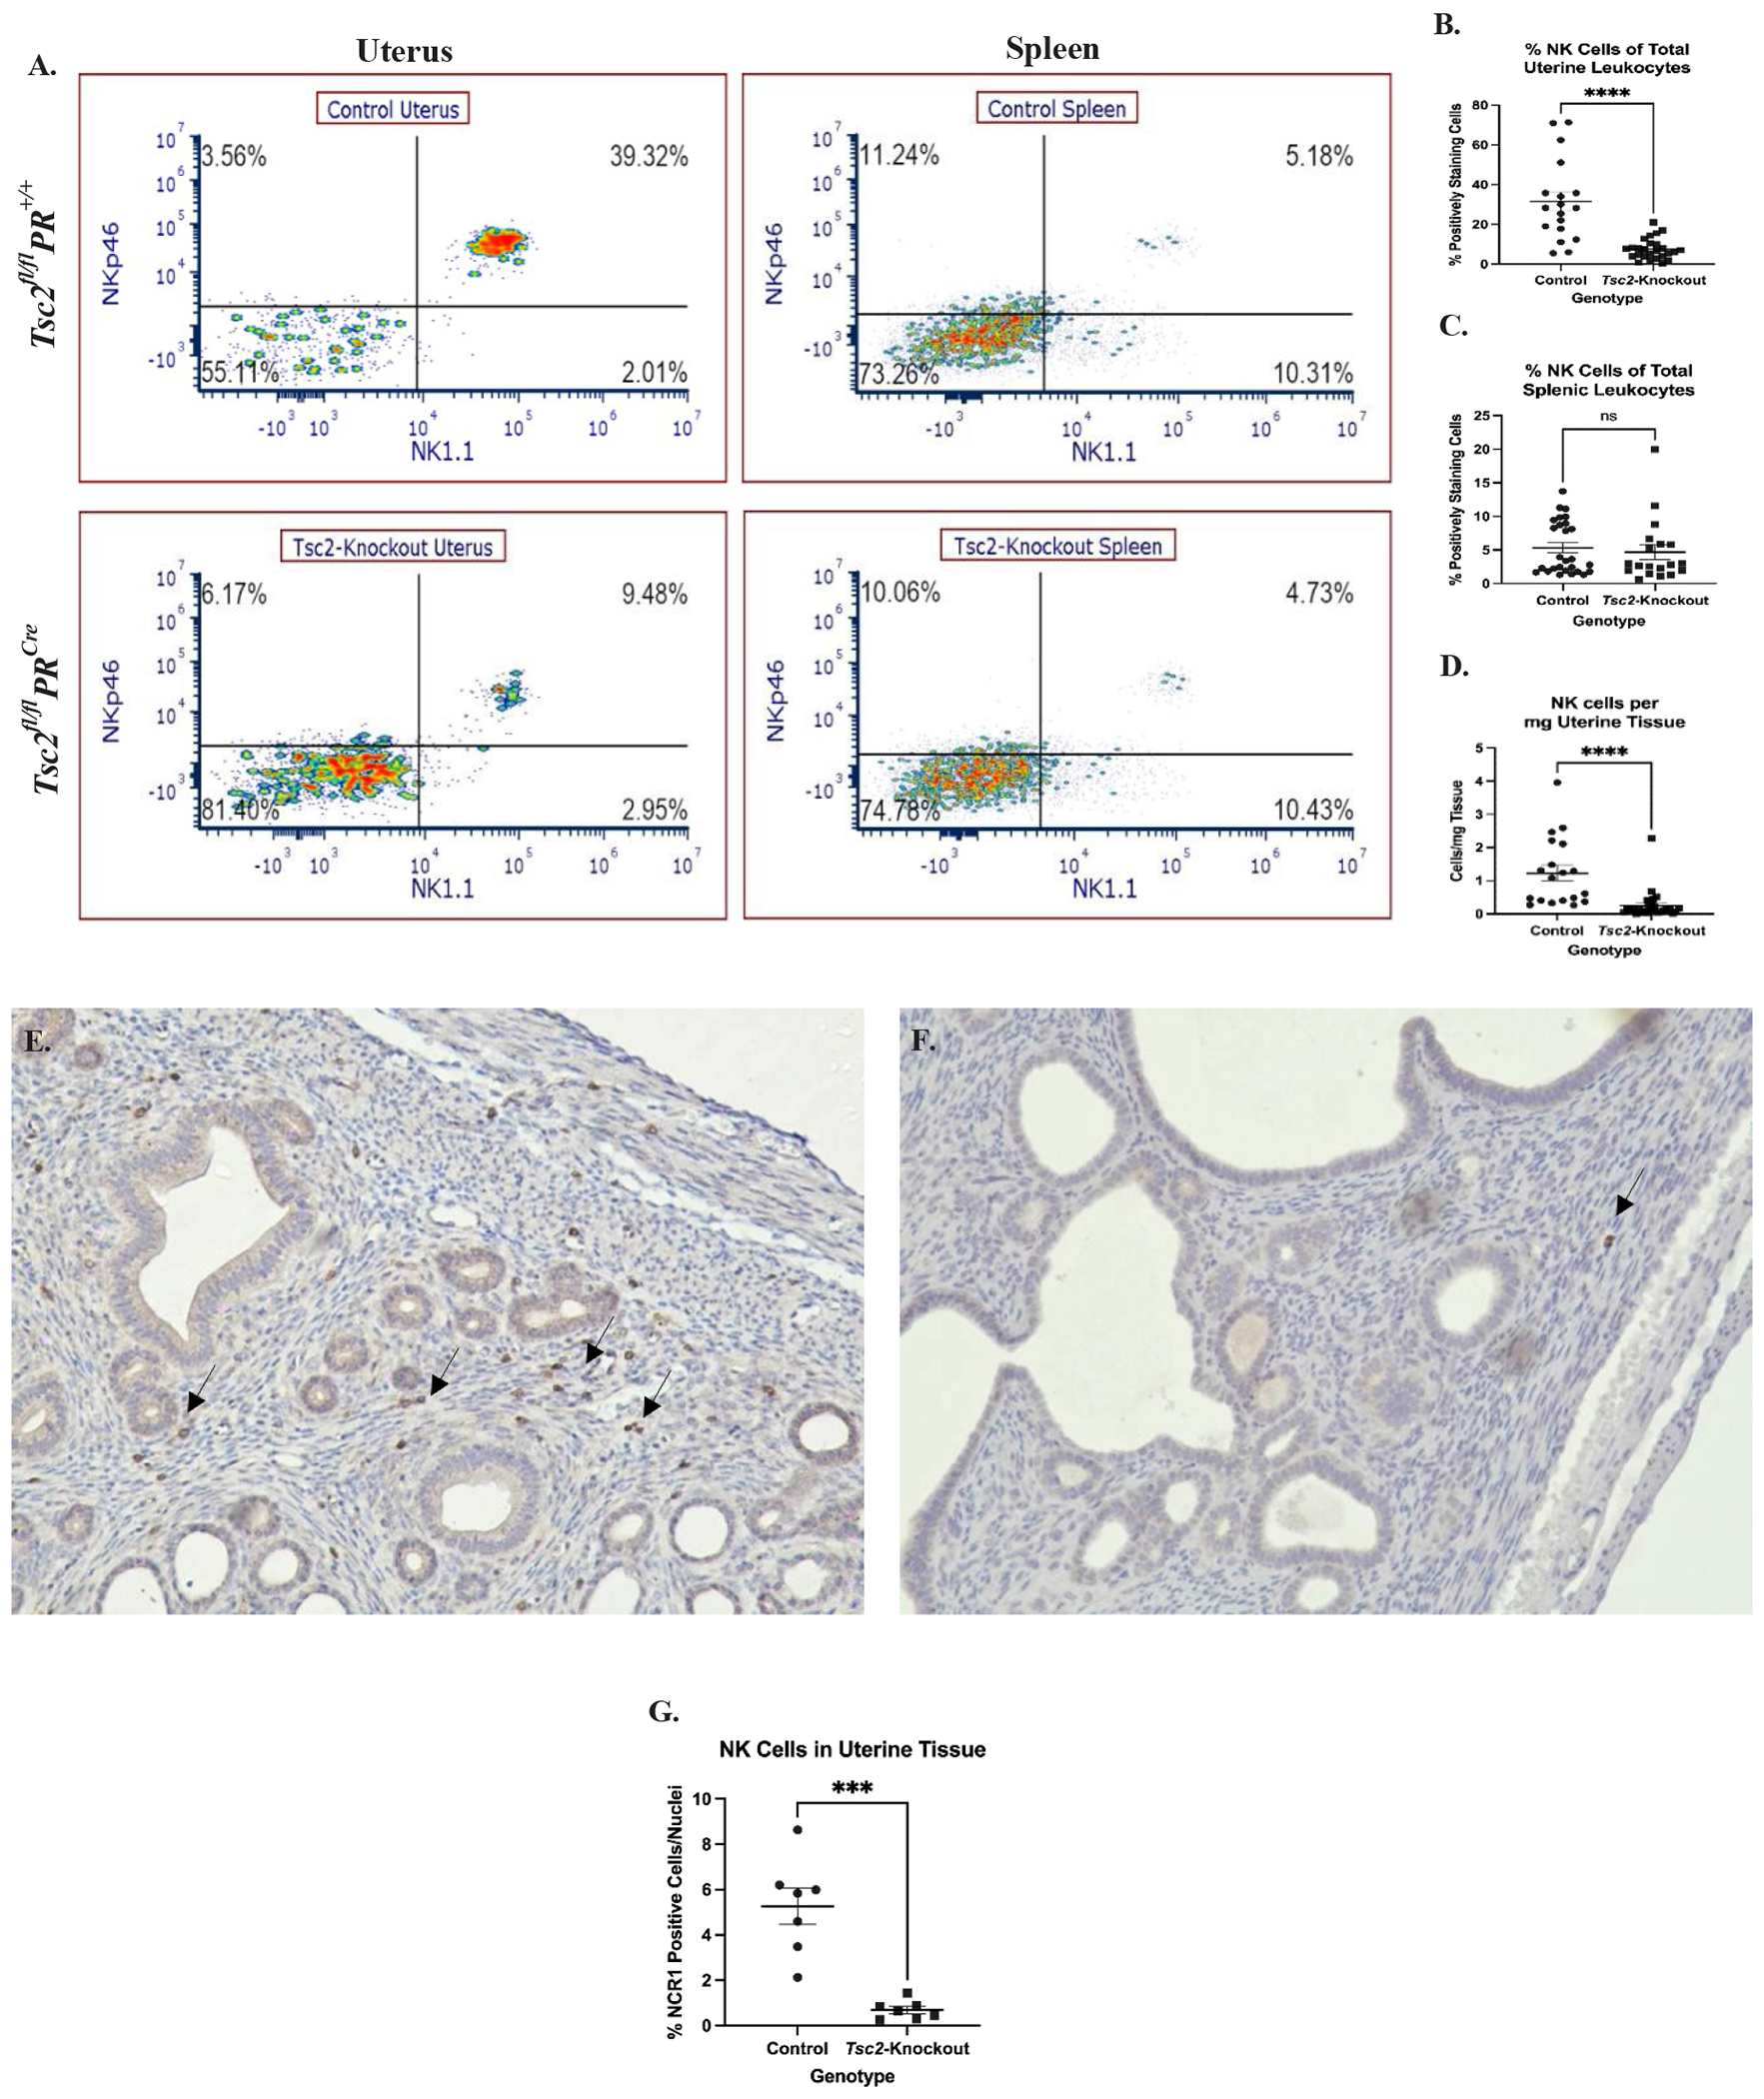
Lymphangioleiomyomatosis (LAM) is a rare, female-dominated pulmonary cystic disease. Cysts that develop in LAM are characterized by the presence of smooth muscle-like (LAMCore) cells in the periphery. These cells harbor mutations in Tuberous Sclerosis Complex 1 or 2 (TSC1/2), driving uncontrolled proliferation through the mTORC1 pathway. LAMCore cells originate from an extrapulmonary source. Published data supports the uterine origin of LAMCore cells that metastasize from the uterus to precipitate pulmonary function destruction. Immune evasion is hypothesized to occur to allow seeding of the lungs from the uterus. This evasion specifically involves dysfunctional NK cells to allow aberrant proliferation and migration from the tissue. Single-cell RNA sequencing revealed changes in chemokine and cytokine protein and receptor expression in uterine NK (uNK) and other immune cell populations in a uterine-specific Tsc2-knockout mouse model of LAM. ELISA data revealed increased concentrations of multiple pro-inflammatory cytokines in the sera of aged Tsc2-knockout mice. Flow cytometry, IHC, and functional assays identified compositional and functional insufficiencies of the uNK cells in Tsc2-knockout mice. Furthermore, depletion of NK cells led to the increased development of pulmonary metastases. These data suggest an inflammatory feedback loop affecting multiple cell types including uNK cells, macrophages, and neutrophils. This leads to alterations in immune cell function and composition which allow for LAMCore cell metastasis from the uterine tissue, which may provide a novel mechanism for LAM development.

Keywords: Inflammation; Lymphangioleiomyomatosis; NK Cells; Single-cell RNA sequencing; Uterus.


Conflict of interest statement

Conflicts of Interest The authors report no conflicts of interest.

Figures

Figure 1.
Figure 1.. Single-cell RNA Sequencing reveals differences in immune cell composition between control and Tsc2-knockout mice.
Five Control and five Tsc2-knockout tissues were harvested, fixed, and single-cell suspensions generated for single-cell RNA sequencing using the 10X Genomics Chromium Next GEM Single Cell Fixed RNA Profiling Platform. A. and B. show 32 identified cell clusters within the UMAP of C57Bl/6J (control) and Tsc2-knockout mice. Ptprc was used to identify the clusters where immune cells reside in control (C.) and Tsc2-knockout (D.) mice. The black circle denotes the immune cell clusters in each genotype. E. Analyses revealed NK cells reside within Cluster 14, which are grouped into the “T Cell” label on the UMAP. Two neutrophil clusters (12 and 30), a granulocytes cluster (9), two macrophage clusters (24 and 27), and three B cell clusters (11, 16, and 32) were identified as well. F. A table summarizing the immune cell types with the associated cluster number. G. The composition of labeled immune cells was normalized to 100% and control and Tsc2-knockout mice demonstrated varying degrees of immune cell enrichments H. The total number of events between control and Tsc2-knockout uteri in the granulocytes and neutrophil populations. I. The total number of events between macrophage clusters in control and Tsc2-knockout uteri. J. The total number of dendritic cell events between genotypes. K. The number of events in both cytotoxic lymphocyte (CTL) clusters 14 and 22 in both genotypes. To identify the presence of NK cells, Ncr1 was used as a cell marker. L. Gene markers for N1 and N2 neutrophils and M1 and M2 macrophages are shown. Additional cytokine (M.) and cytokine receptors (N.) in the macrophage, neutrophil, granulocyte, and CTL populations. O. Differences in gene expressions for chemokines and chemokine receptors were noted in the macrophage, neutrophil, granulocyte, and CTL populations in the Tsc2-knockout uteri. Graphs show log2fold changes, and all genes shown are significantly differentially expressed (padj≤0.05) in the Tsc2-knockout uterus compared to the controls. Shades of red indicate upregulation, and blue denotes downregulation in heatmaps.
Figure 2.
Figure 2.. Single-cell reveals an aberrantly proliferating cell population within the Tsc2-knockout uteri similar to human LAM cells.
Investigation into cluster 6 was performed due to the distinct lack of cells in this cluster in control mice compared to Tsc2-knockout mice. A. UMAPs of control and Tsc2-knockout mice with a circle denoting the location of cluster 6. B. Cell numbers were enriched in cluster 6 in Tsc2-knockout compared to controls. C. Cell type assignments listed the most likely labels for the cell cluster. D. Functional and E. disease pathway enrichments in the Tsc2-knockout mice attributed to differentially expressed genes (DEGs) in the cluster. The brighter red indicates a more significant term (see Ref. 76). F. Gene expression for LAMCore cell markers in cluster 6 of the Tsc2-knockout mice (see Ref. 18).
Figure 3.
Figure 3.. Altered gene expression for ECM organization, ECM degradation, and immune responses in immune cells.
After identifying the uterine immune cells and DEGs in immune clusters, we performed pathway analyses using Reactome. Reactome performed over-representation analyses on DEGs in Tsc2-knockout mice identified which pathways are enriched in each cluster. The enriched pathways in each cluster are shown in tables with statistical results. Statistical analyses performed as described in Methods (see Refs. and 69).
Figure 4.
Figure 4.. Inflammatory cytokine profiling of Tsc2-knockout mice demonstrates a pro-inflammatory milieu that would influence immune cell function.
Serum was collected from control and Tsc2-knockout mice aged between 14-32 weeks old. A standard 13-cytokines inflammatory LEGENDPlex assay was performed to profile the cytokines in these mice as described in Methods. A.-G. Cytokine expression is significantly increased in the sera of Tsc2-knockout mice. For the groups, n=25 controls and 19 Tsc2-knockout, one assay performed, 3 technical replicates per sample, data are log transformed, and dotted line indicates the Limit of Detection. Graphs are mean ± SEM and Mann-Whitney test at p=0.05 performed.
Figure 5.
Figure 5.. Decreased uNK cells in Tsc2-knockout mice uteri.
Phenotyping was performed to assess the composition of the uterine cytotoxic lymphocytes. CD45+CD3NK1.1+NKp46+ defined uNK cells as described in Methods. A. Representative flow cytometry plots demonstrating the difference in uNK cell incidence between control and Tsc2-knockout mice. Spleens were stained alongside as an internal control. B-C. Quantification of percent positively staining cells of splenic NK cells (B.) and uNK cells (C.) per total leukocytes. D. Normalization for differences in tissue mass digested to compare uNK cells abundance. Plots are cells per mg of tissue. E.-G. IHC was performed using an anti-NCR1 (NKp46) antibody to detect uNK cells. Representative images of control (E.) and Tsc2-knockout (F.) uteri are shown. Arrows denote positively staining cells within the tissue. G. Quantification of tissue uNK cells in tissue samples. For flow data, experiments were performed 10 times, n=19-27, and unpaired Student’s T test with p=0.05. Gating strategy is described in the methods. For IHC staining, experiments were performed 4 times, n=8 total for each group.
Figure 6.
Figure 6.. Increased uNK cell death results in a reduction in cell number in Tsc2-knockout mice.
To investigate uNK apoptosis, a flow cytometry-based apoptosis assay employing a fluorescent Caspase-3/7 and 7-AAD staining was performed. Apoptosis was defined by Caspase-3/7 single staining, and necrosis, defined by Caspase-3/7 and 7-AAD dual staining, was measured on uNK cells from both genotypes. A. Representative flow cytometry plots of uNK cells shown. B. Quantification of the Caspase-3/7 single positive apoptotic cells. C. Quantification of the 7-AAD and Caspase-3/7 dual positive necrotic uNK cells. Spleens stained and analyzed alongside the uteri as an internal control comparison shown in Figure S5A. Experiments were performed 3 independent times, n=6-7 total, and Student’s unpaired t test performed at p=0.05. All graphs are mean ± SEM. Gating strategy is described in the methods section.
Figure 7.
Figure 7.. Increased NKG2A expression indicates dysfunctional uNK cells.
The expression of the common inhibitory receptor NKG2A was measured via flow cytometry. A. Representative flow cytometry plots of NKG2A expression on CD45+CD3NK1.1+NKp46+ NK cells from control and Tsc2-knockout uteri. B. Quantification of the percent of uNK cells expressing NKG2A and C. NKG2A expression by Mean Fluorescence Intensity (MFI). Splenic NK cells analyzed as an internal control shown in Figure S5B. Student’s unpaired t test performed at p=0.05, n=6-7. Graphs are Mean ± SEM.
Figure 8.
Figure 8.. Increased uNK cell activity in Tsc2-knockout mice.
Isolated lymphocytes were stimulated to assess functional responses as indicated by IFNγ production. Cells were pretreated with Brefeldin A to prevent cytokine release and allow for intracellular staining. A. IFNγ positive cells left in culture with maintenance doses of IL-2 and IL-15 only. B. IFNγ positive cells after maintenance cytokines in addition to LPS treatment. C. IFNγ positive cells after maintenance cytokines in addition to phorbol 12-myristate 13-acetate (PMA) and ionomycin (PMA/I) treatment. D. IFNγ positive cells after maintenance cytokines in addition to IL-12 and IL-18. Splenic lymphocytes were analyzed as an internal control shown in Figure S5C. All graphs show an n=5-7/genotype and Student’s T Test performed at p=0.05. All graphs are mean ± SEM.
Figure 9.
Figure 9.. In vivo depletion of NK cells results in the development of pulmonary nodules at an earlier age.
NK cell depletion was performed utilizing an anti-NK1.1 antibody. A. A visual schematic of the experimental design. Control and Tsc2-knockout mice were injected once/weekly with 25 μg of anti-NK1.1 or isotype control IgG2a antibody I.P. beginning at 12 weeks of age. After 12 weeks, mice were euthanized and tissues collected. Flow cytometry was performed on blood and isolated uterine cells. NK cells were defined as: CD45+CD3NKp46+CD49b+. B. Peripheral blood stained for NK cells. C. Uterine lymphocytes isolated were collected and stained for NK cells. Panels D.-G. Representative staining of lungs from each cohort for pS6, a marker of cell proliferation through the mTORC1 pathway and LAMCore cells. D. and E. Control mice lungs that received isotype IgG2a control injections (D.) or anti-NK1.1 injections (E.). F. and G. Tsc2-knockout mice lungs that received isotype IgG2a injections (F.) or anti-NK1.1 injections (G.). H. Quantification of the number of nodule-like structures found in each individual mouse in each cohort. For all tissues and genotypes, n=3-6, experiment performed in two groups, Two-Way ANOVA performed at p=0.05. Graphs are mean ± SEM. Experimental graphic made using BioRender.com.

Similar articles

References

    1. Guarino M, Perna B, Cesaro AE, Maritati M, Spampinato MD, Contini C, et al. 2023 Update on Sepsis and Septic Shock in Adult Patients: Management in the Emergency Department. J Clin Med. 2023. Apr 28;12(9):3188. - PMC - PubMed
    1. Krymskaya VP, McCormack FX. Lymphangioleiomyomatosis: A Monogenic Model of Malignancy. Annu Rev Med. 2017;68:69–83. - PMC - PubMed
    1. Henske EP, McCormack FX. Lymphangioleiomyomatosis - a wolf in sheep’s clothing. J Clin Invest. 2012;122(11):3807–16. - PMC - PubMed
    1. McCarthy C, Gupta N, Johnson SR, Yu JJ, McCormack FX. Lymphangioleiomyomatosis: pathogenesis, clinical features, diagnosis, and management. Lancet Respir Med. 2021;9(11):1313–27. - PubMed
    1. McCormack FX, Travis WD, Colby TV, Henske EP, Moss J. Lymphangioleiomyomatosis: calling it what it is: a low-grade, destructive, metastasizing neoplasm. Am J Respir Crit Care Med. 2012;186(12):1210–2. - PMC - PubMed

LinkOut - more resources