. 2025 Aug 15:16:1655290.
doi: 10.3389/fgene.2025.1655290. eCollection 2025.

A retrospective analysis of 38,652 amniotic fluid karyotype

Affiliations

A retrospective analysis of 38,652 amniotic fluid karyotype

Jianyu Ren et al. Front Genet. .

Abstract

Background: Chromosomal karyotype analysis remains a classical and frontline method in prenatal diagnosis, capable of detecting balanced chromosomal abnormalities and providing insights distinct from high-resolution molecular techniques such as CMA and CNV-Seq. However, large-scale studies on the distribution of structural abnormalities and mosaicism in amniotic fluid karyotypes are scarce, with most previous research focusing on common aneuploidies.

Objective: The study aimed to elucidate the relationship between chromosomal structural abnormalities and specific chromosomes.

Methods: We established a large-scale amniotic fluid karyotype database by collecting prenatal diagnostic indications and karyotype analysis results from amniotic fluid samples of 38,652 pregnant women who underwent prenatal diagnosis at the Beijing Obstetrics and Gynecology Hospital.

Results: From 2010 to 2024, the proportion of high-risk serological screening cases showed a decreasing trend year by year, while the proportions of high-risk non-invasive prenatal testing, increased nuchal translucency, and ultrasound abnormalities all showed increasing trends. Among all results, the proportions of non-mosaic abnormalities, mosaicism, polymorphisms, and normal karyotypes were 4.68%, 0.71%, 1.7%, and 92.91%, respectively. Inversion of chromosome 9 and variations in heterochromatin length of the Y chromosome were the most common polymorphisms. Sex chromosome aneuploidies were more prone to mosaicism. Inversions of chromosomes 9 and Y were the most frequent types of inversions. Robertsonian translocations occurred most commonly between chromosomes 13 and 14, while reciprocal translocations were most frequently observed between chromosomes 11 and 22. Chromosome breakage was most common in chromosomes Y and 1, whereas deletions were most frequently detected in chromosomes X and 5. Isochromosomes mainly appeared in a mosaic form in chromosome X. Among all indication groups, high-risk NIPT was associated with the highest positive rate for unbalanced abnormalities. A searchable karyotype database was setup, which allows users to query abnormal karyotypes identified in this study.

Conclusion: Specific chromosomal abnormalities and mosaicisms tend to occur in particular chromosomes. Therefore, attention should be paid to specific chromosomes during karyotype analysis.

Keywords: amniocentesis; chromosomal aberrations; database; karyotype analysis; prenatal diagnosis.


Conflict of interest statement

The authors declare that the research was conducted in the absence of any commercial or financial relationships that could be construed as a potential conflict of interest.

Figures

FIGURE 1
FIGURE 1
Data Analysis Flowchart. After collecting patient data, samples with failed cultures are excluded, and the prenatal indications for the pregnant women are classified. The chromosomal karyotype results are then classified sequentially into Level 1 to Level 4 categories. * Hermaphroditism, triploid, and normal karyotypes were annotated as “None”.
FIGURE 2
FIGURE 2
Changes in Amniocentesis Indication Composition by Year (A) Number of samples collected from 2010 to 2024. Samples were collected in all years except 2017, with a smaller number collected in 2011 and 2018. (B) Proportion of advanced maternal age cases across years. The proportion of advanced maternal age remained relatively stable from 2010 to 2024. (C) Proportion of high-risk serum screening result pregnancies across years. The proportion of high-risk serum screening result gradually decreased from 2010 to 2024. (D) Proportion of high-risk NIPT cases across years: The proportion of high-risk NIPT gradually increased from 2010 to 2024. (E) Proportion of pregnancies with increased NT across years. The proportion of pregnancies with increased NT gradually increased from 2010 to 2024. (F) Proportion of pregnancies with ultrasound abnormalities across years. The proportion of pregnancies with ultrasound abnormalities gradually increased from 2010 to 2024.
FIGURE 3
FIGURE 3
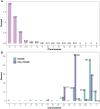
Positive Detection Rates in Mosaic Level (A) Detection rate of mosaicism by year. The overall positive rate for mosaicism is 0.71%, showing an increasing trend. (B) Detection rate of non-mosaic abnormalities by year. The overall positive rate for non-mosaic abnormalities is 4.68%, showing an increasing trend. (C) Detection rate of polymorphisms by year. The overall positive rate for polymorphisms is 1.7%, with the detection rate remaining relatively stable. (D) Detection rate of normal samples by year. The overall positive rate for normal samples is 92.91%, showing a decreasing trend. (E) The proportion of each chromosome length polymorphisms in the detected length polymorphisms. The Y chromosome has the highest proportion (18.69%), followed by chromosome 15 (17.38%). (F) Detection rate of chromosome length polymorphisms in the overall fetus sample. The Y chromosome has the highest detection rate of length polymorphisms (0.148%), followed by chromosome 15 (0.137%).
FIGURE 4
FIGURE 4
Detection Rates of Chromosomal Aneuploidies (A) Detection rates of chromosomal aneuploidies. Trisomy 21, X chromosome aneuploidy, trisomy 18, and marker chromosomes were the most frequently detected aneuploidies, with detection rates of 1.89%, 1.27%, 0.55%, and 0.13%, respectively. (B) Proportions of chromosomal aneuploidies in mosaic and non-mosaic cases: Aneuploidies of the X chromosome (46.12% vs. 29.00%), marker chromosomes (13.24% vs. 1.64%), and Y chromosome (11.42% vs. 0.15%) were significantly more prevalent in mosaic cases compared to non-mosaic cases. In contrast, trisomy 21 (52.09% vs. 14.61%) and trisomy 18 (15.17% vs. 3.65%) were more frequently observed in non-mosaic cases than in mosaic ones.
FIGURE 5
FIGURE 5
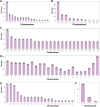
Number of Structural Abnormalities Detected in Each Chromosome (A) Number of chromosomal inversions detected. Inversions were most commonly detected in chromosomes Y, 10, and 1, with 23, 8, and 7 cases respectively. Chromosome 9 is not shown. (B) Number of Robertsonian translocations detected. The most frequently detected Robertsonian translocations occurred between chromosomes 13 and 14, 14 and 21, and 21 and 21, with 47, 15, and 14 cases respectively. (C) Number of chromosomal reciprocal translocations detected. Reciprocal translocations between chromosomes 11 and 22 (8 cases), and between 2 and 10 (5 cases) were the most common. (D) Number of chromosomal breaks detected. The Y chromosome had the highest number of breaks detected (60 times). In general, the number of breaks correlated with chromosome size, except for chromosome 18, which exhibited disproportionately more breaks relative to its length. (E) Number of chromosomal deletions detected. Deletions were most frequently observed in chromosomes 5, X, and 18, with 11, 11, and 10 cases respectively. (F) Number of isochromosomes detected. Isochromosomes were detected in chromosomes X (14 cases), Y (4 cases), and 12 (1 case).
FIGURE 6
FIGURE 6
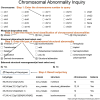
Chromosomal Result Query Interface. To query chromosomal results, sequentially input the chromosome number, mosaicism classification, structural abnormality classification, and whether the abnormality is balanced. Click on “Reporting of Karyotypes” to obtain the chromosomal abnormal karyotype results detected in this study.

Similar articles

References

    1. Chuang T. H., Chang Y. P., Lee M. J., Wang H. L., Lai H. H., Chen S. U. (2020). The incidence of mosaicism for individual chromosome in human blastocysts is correlated with chromosome length. Front. Genet. 11, 565348. 10.3389/fgene.2020.565348 - DOI - PMC - PubMed
    1. Evans M. I., Henry G. P., Miller W. A., Bui T. H., Snidjers R. J., Wapner R. J., et al. (1999). International, collaborative assessment of 146,000 prenatal karyotypes: expected limitations if only chromosome-specific probes and fluorescent in-situ hybridization are used. Hum. Reprod. 14 (5), 1213–1216. 10.1093/humrep/14.5.1213 - DOI - PubMed
    1. Fukami M., Miyado M. (2022). Mosaic loss of the Y chromosome and men's health. Reprod. Med. Biol. 21 (1), e12445. 10.1002/rmb2.12445 - DOI - PMC - PubMed
    1. Hao M., Li L., Zhang H., Liu R., Yu Y. (2020). The difference between karyotype analysis and chromosome microarray for mosaicism of aneuploid chromosomes in prenatal diagnosis. J. Clin. Lab. Anal. 34 (12), e23514. 10.1002/jcla.23514 - DOI - PMC - PubMed
    1. Lim J., Hubbard A. K., Blechter B., Shi J., Zhou W., Loftfield E., et al. (2024). Associations between mosaic loss of sex chromosomes and incident hospitalization for atrial fibrillation in the United Kingdom. J Am Heart Assoc. 13. 10.1161/JAHA.124.036984 - DOI - PMC - PubMed

LinkOut - more resources