[Preprint]. 2025 Aug 20:rs.3.rs-7312705.
doi: 10.21203/rs.3.rs-7312705/v1.

Connectome of a human foveal retina

Affiliations

Connectome of a human foveal retina

Yeon Jin Kim et al. Res Sq. .

Abstract

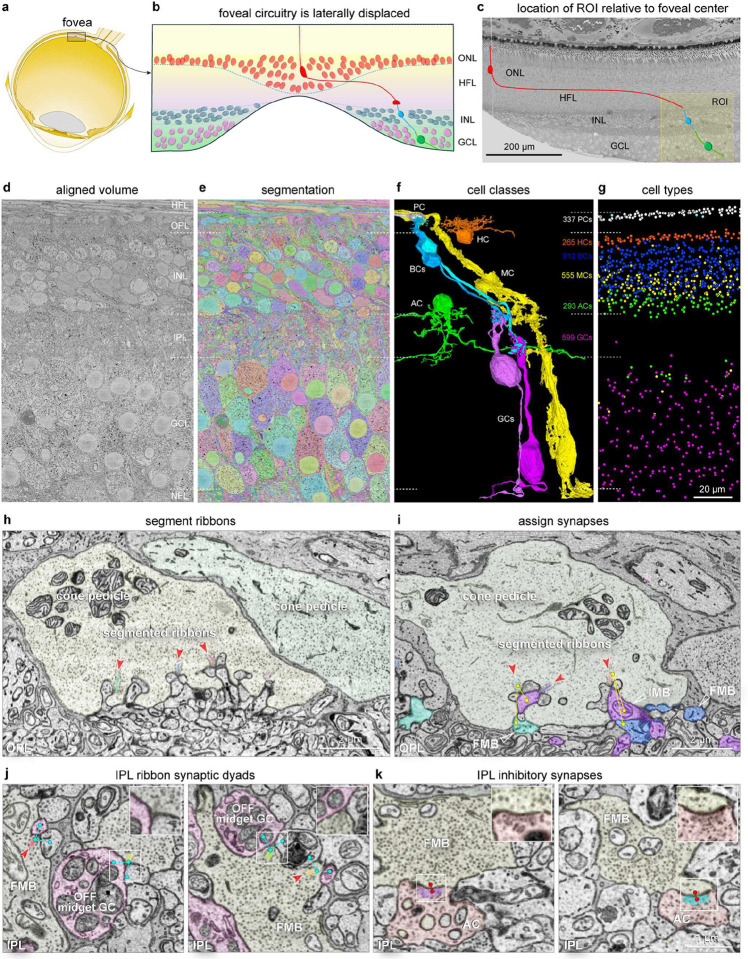
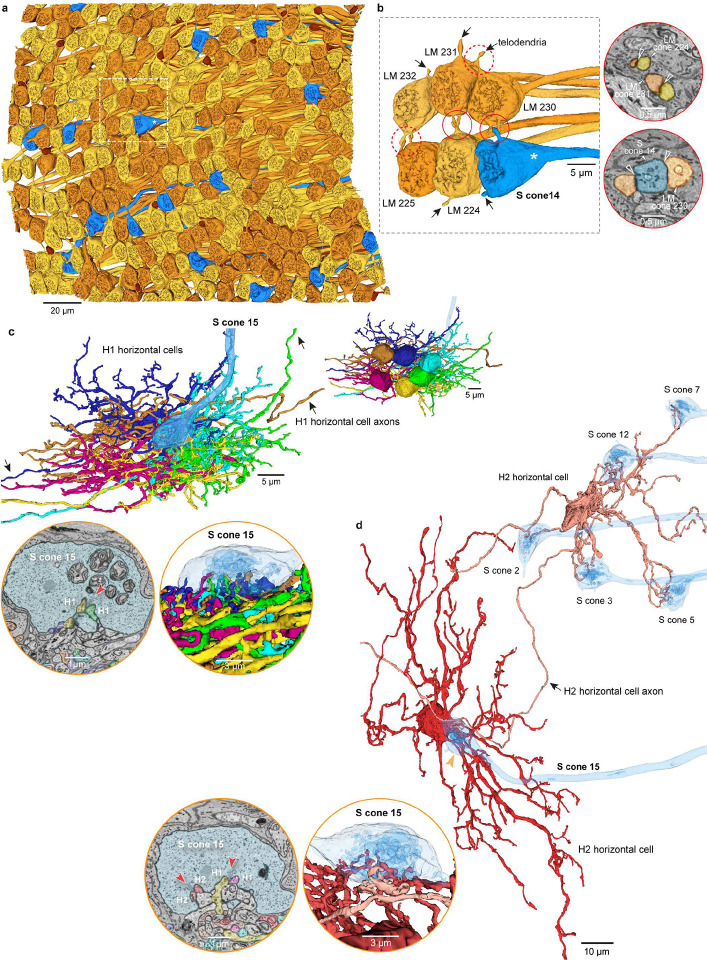
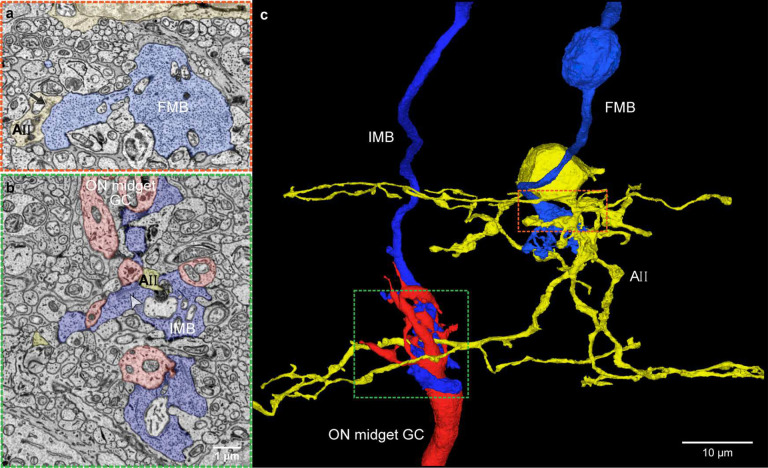
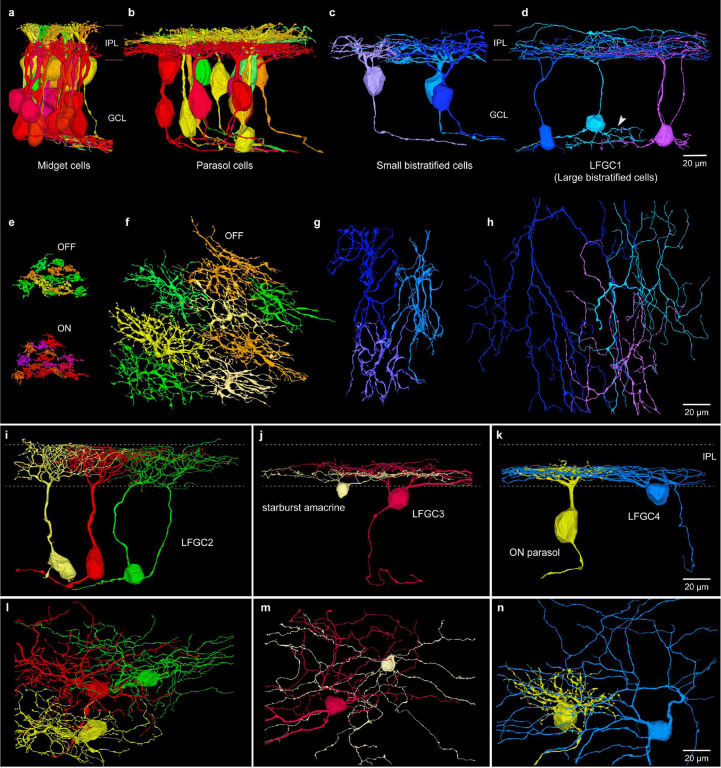
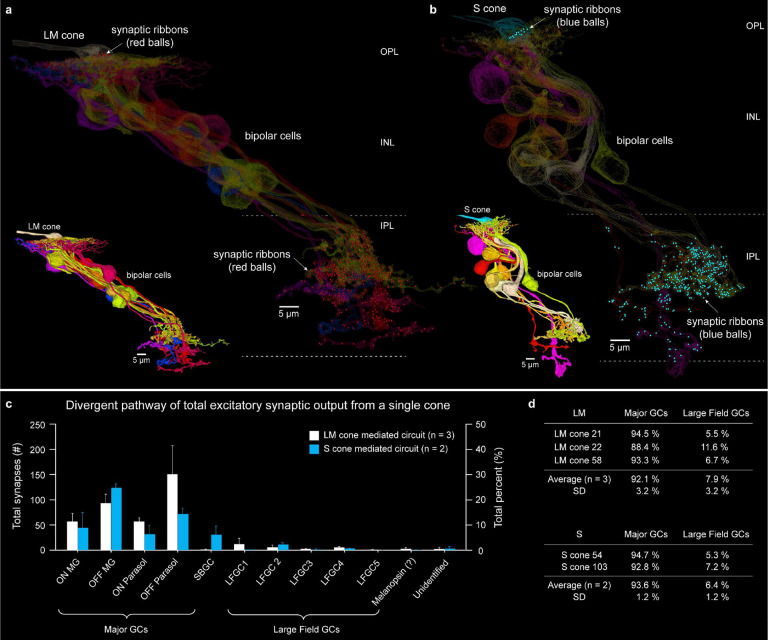
What makes human brains distinctive? The answer is hidden at least partially in the myriad synaptic connections made between neurons - the connectome. The foveal retina is a primate specialization which presents a feasible site for deriving a complete connectome of a human CNS structure. In the fovea, cells and circuits are miniaturized and compressed to densely sample the visual image at highest resolution and initiate form, color and motion perception. Here we provide a draft connectome of all neurons in a human fovea. We found synaptic connections, distinct to humans, linking short-wavelength sensitive cones to color vision pathways. Moreover, by reconstructing excitatory synaptic pathways arising from cone photoreceptors we found that over 95% of foveal ganglion cells contribute to only three major pathways to the brain. Our study reveals unique features of a human neural system and opens a door to a complete foveal connectome.


Conflict of interest statement

Declaration of interests K.L., N.K., D.I., T.N., R.L., S.P., A.H., J.A.B., J.S. and T.M. declare financial interests in Zetta AI. S.G. is owner of Aware LLC and developed the NeuroMaps.app. The remaining authors declare no competing interests.

Figures

Fig. 1.
Fig. 1.. The HFseg1 volume.
a. The fovea forms a pit in the retina ~3 mm temporal to the optic disc (within the inset rectangle). b. Schematic foveal pit showing cone (red) to bipolar cell (blue) to ganglion cell (green) circuit. ONL, outer nuclear layer, HFL, Henle fiber layer; INL, inner nuclear layer; GCL, ganglion cell layer. c. Trimmed retinal block face and ROI (yellow box) in temporal retina 400–500 μm from the foveal center. d. Single section from the imaged volume (cropped laterally) to illustrate the retinal layers, HFL, OPL, outer plexiform layer; INL; IPL, inner plexiform layer, GCL and NFL, nerve fiber layer. e. Volume segmented into membrane bound objects. f. Examples of segmented cells photoreceptor axon terminal (PC, white), horizontal cell (HC, orange), ON and OFF bipolar cells (BC, light and dark blue), Müller glia cell (MC, yellow), amacrine cells (AC, green), ON and OFF ganglion cells (GC, dark and light violet); astrocytes and microglia not shown here. g. Numbers and cell soma locations of the cell types shown in f. h. Three segmented ribbons (varied colors) at synaptic triads (red arrowheads) in a single cone pedicle. i. Synaptic assignments associated with each ribbon (yellow dots and lines). An IMB (inner-ON midget bipolar; violet, white open arrowhead) cell makes an invaginating contact and two FMB cells (outer-OFF midget bipolar; light and dark blue, white open arrowheads) make a basal contact with the cone pedicle. j. Examples of ribbon and synapse prediction in the inner plexiform layer (IPL) for an FMB cell axon terminal at two locations (left and right panels). Segmented ribbons (varied colors, red arrowheads) and synaptic predictions (blue dots, lines). k. Synaptic vesicle cloud segmentation (varied colors) and synaptic prediction (red dots and lines) in the IPL between an amacrine cell and an FMB axon terminal. Insets in j and k show zoomed view of synapses indicated by white boxes.
Fig. 2.
Fig. 2.. Photoreceptor and horizontal cell populations.
a. Array of photoreceptor axon terminals (cone pedicles, rod spherules) viewing the synaptic face of the terminals (297 LM cones, gold; 16 S cones, blue, 24 rods, brown) (see Supplementary Data Table 1a, 1c, 1d). b. Six cone pedicles within the white dotted box in a. Left, the pedicles contact each other via telodendria (e.g., arrows) within the circled areas. A pedicle identified as an S cone (white asterisk) contacts neighboring LM cone 230. Right, EM micrographs showing telodendritic contacts (open white arrowheads) between LM cones (top) and S cone with LM cone (bottom). c. Six overlapping H1 cells are shown (varied colors); each H1 cell forms lateral elements in S cone 15 (blue). Upper inset shows the cell bodies of the six H1 cells. Circle inset at lower left shows EM view of H1 cell lateral elements at a synaptic invagination of S cone 15 (red arrowhead). Circle inset at lower right shows a 3D view of S cone 15 (partial transparency) contacting multiple H1 cells. d. Two H2 cells (tan and red) contacting multiple S cones, including S cone 15. Lower insets show H2 cell lateral elements at S cone 15 in single layer EM view (left) and 3D (right) view (conventions as in c).
Fig. 3.
Fig. 3.. Bipolar cell types.
a. Outer stratifying types (FMB, flat midget bipolar; DB, diffuse bipolar). Outer-x bipolar cells lacked a dendrite but made ribbon synapses in the IPL (Extended Data Fig. 6a). DBbroad cells extend processes across the IPL depth (Extended Data Fig. 7). b. Inner stratifying bipolar types; IMB, invaginating midget bipolar; DB, diffuse bipolar types; BB, blue-cone bipolar type, Inner-x bipolar (Extended Data Fig. 6c); RB, rod bipolar. c. Horizontal view of spatial mosaics of axon terminals for small groups of neighboring cells of each bipolar type, as indicated.
Fig. 4.
Fig. 4.. Amacrine cells.
Amacrine cells in the INL (253 cells) and GCL (40 cells) were divided into 19 types (AC1–19; Supplementary Data Table 1g). a. Small field, AII amacrine cells (AC2), in vertical view show outer, lobular dendrites (white arrowhead) and extensive, inner dendrites (green arrowhead). b. Horizontal view of the entire AII population in HFseg1; lower panel, vertical view. c. Starburst amacrine cells (AC7) were located primarily in the GCL (GCL, 14 cells; INL, 3 cells). White arrowheads indicate typical fasciculation of starburst dendrites. d. Mosaic of starburst cells, GCL cells (red-violet) and INL cells (yellow); lower panel, vertical view. e. Small field amacrine type (AC11) in horizontal view with densely branched dendritic arbor. f. Horizontal view of the AC11 cell mosaic; lower panel, vertical view shows dendrites extend broadly across the IPL. g. Large field amacrine cells (AC8) with thick lobular dendrites, narrowly stratified in the outer IPL. h. Horizontal view of the complete mosaic; lower panel shows vertical view of outer IPL stratification. Scale bar in c applies to e and g. Scale bar in lower panel of h applies to b, d, f.
Fig. 5.
Fig. 5.. AII amacrine cells are connected to the ON and OFF midget circuit.
a. The AII cells provide abundant inhibitory synaptic output to FMB (OFF-midget bipolar) cells (black arrow and orange boxed area in c). b. Rod bipolar cells are largely absent in HFseg1 volume. This AII cell (yellow) receives alternate excitatory synaptic input from IMB (ON-midget bipolar) cells (white arrowhead and green boxed in c). c. Vertical 3D view; AII cell shown in yellow. FMB and IMB cells shown in blue. ON midget ganglion cell in red; OFF midget ganglion cell not shown in this image.
Fig. 6.
Fig. 6.. Synapse detection.
a. OFF midget bipolar (yellow) and ON midget bipolar (red) presynaptic to an outer-OFF (blue) and inner-ON (green) midget ganglion cell. b. Outgoing synapses detected for the midget bipolar cell axon terminals shown in a (ganglion cells removed, semi-transparent view). Synaptic ribbons (red/violet dots) and postsynaptic profiles were first identified manually (see Extended Data Fig. 9; cone 22; BC 308 (IMB) and BC 303 (FMB)). Predicted outgoing synapses (green dots and lines, IMB; blue dots and lines, FMB). White arrowheads numbered 1–4 indicate the panels shown on the right in single layer EM view. Predicted and segmented synaptic ribbons (in varied colors, red arrowheads); predicted postsynaptic segments are marked by the dots and lines linking the synaptic ribbon to its postsynaptic structure (unlabeled postsynaptic profiles belong to amacrine cells). Inset histogram shows precision and sensitivity of ribbon detection and synaptic assignment. c. Inhibitory output synapses made by two neighboring AII amacrine cells (purple and orange in partial transparency). Yellow dots show synaptic output predictions; most synaptic outputs arise in the outer half of the IPL and are presynaptic to OFF bipolar cells. Inset shows precision and sensitivity for the synapses made by each AII cell. d-e. Single layer images showing segmented vesicle clouds (varied colors) in the purple AII cell (shown in c) and synaptic connections predicted with an FMB cell (yellow dots and lines; ribbons in the FMB are also segmented). f-g. Same conventions as in d-e but showing three segmented vesicle clouds and synaptic predictions for the orange AII cell (shown in c), with another FMB cell.
Fig. 7.
Fig. 7.. Ganglion cells.
a. Cluster of inner-ON (red-violet) and outer-OFF (yellow-green) midget ganglion cells; dendrites stratify broadly across inner (ON) and outer (OFF) half of the IPL. b. Inner-ON (red-violet) and outer-OFF (yellow-green) parasol ganglion cells; dendrites stratify broadly near the center of the IPL. c. Small bistratified ganglion cells extend dendrites across the ON-OFF subdivision of the IPL. d. Large bistratified ganglion cells (LBGC1) show large dendritic field and broad stratification. White arrowhead shows branching processes arising from the cell body of unknown significance. e-h, Mosaic of dendritic arbors in horizontal view of the same cells shown in a-d. e. Outer-OFF (yellow-green, top) and inner-ON (red-violet) midget GC. f. Outer-OFF parasol cell dendrites show minimal overlap (inner-ON parasol mosaic not shown). g. Small bistratified cells show minimal dendritic tree overlap. h. LFGC1 (Large bistratified cells) show a much larger and more sparsely branching irregular tree. i-k. Morphology of three additional large field types. i. LFGC2 (Large diffuse cells) show a densely branched tree broadly stratified across the IPL. j. LFGC3 (Recursive bistratified cells) are narrowly bistratified near center of the IPL and tend to fasciculate with starburst amacrine cells. k. LFGC4 (Inner smooth monostratified cells) show large, monostratified dendritic trees costratified with parasol cells. l-n. Horizontal views of the cells shown in i-k.
Fig. 8.
Fig. 8.. Vertical excitatory connectome.
a. Vertical connectome for a single LM cone (cone 22, see details in Extended Data Fig. 9b). Cone pedicle and postsynaptic bipolar cells shown in silhouette. Synaptic ribbons in the cone pedicle (top, OPL) and bipolar cell axon terminals (lower, IPL) are shown as red balls. Inset shows all bipolar cells postsynaptic to this cone pedicle (outer, yellow-gold; inner, blue-violet-red). b. The same views for an identified S-cone (cone 103, see details in Extended Data Fig. 10b; synaptic ribbons, blue dots). c. Histogram shows output synapse numbers (left axis), and percent (right axis) made via bipolar cells connected to 3 LM and 2 S cones with postsynaptic GC types. Note that OFF pathway derived synapses greatly outnumber ON pathway synapses. d. The great majority of synapses from LM and S cones are distributed to midget, parasol and small bistratified ganglion cells (Major GCs) with all other large field types receiving 7.9% (LM) and 6.4% (S) of the synaptic output (see also Supplementary Data Table 2). Unidentified processes account for 0.5% of total synaptic output (LM) (see Supplementary Data Table 2a-2c).

References

    1. Ramon y Cajal S. La rètine des vertèbrès. La Cellule 9, 119–257 (1892).
    1. Masland R.H. & Raviola E. Confronting complexity: strategies for understanding the microcircuitry of the retina. Annual review of neuroscience 23, 249–284 (2000). - PubMed
    1. Dowling J.E. The Retina: An approachable part of the brain (Harvard University Press, Cambridge, MA, 2012).
    1. Rodieck R.W. The First Steps in Seeing (Sinauer Associates, Inc., Sunderland MA, 1998).
    1. Helmstaedter M., et al. Connectomic reconstruction of the inner plexiform layer in the mouse retina. Nature 500, 168–174 (2013). - PubMed

Publication types

LinkOut - more resources