The scaffold-level genome sequence of an encrusting sponge, Halisarca caerulea Vacelet & Donadey, 1987, and its associated microbial metagenome sequences
- PMID: 40894108
- PMCID: PMC12391866
- DOI: 10.12688/wellcomeopenres.24281.1
The scaffold-level genome sequence of an encrusting sponge, Halisarca caerulea Vacelet & Donadey, 1987, and its associated microbial metagenome sequences
Abstract
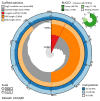
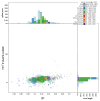
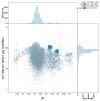
We present a scaffold-level genome assembly from a Halisarca caerulea specimen (encrusting sponge; Porifera; Demospongiae; Chondrillida; Halisarcidae). The genome sequence is 195.70 megabases in span. The mitochondrial genome has also been assembled and is 19.15 kilobases in length. Gene annotation of this assembly on Ensembl identified 26,722 protein-coding genes. The metagenome of the specimen was also assembled and four binned bacterial genomes related to the relevant sponge symbiont clades Alphaproteobacteria bacterium GM7ARS4 and Gammaproteobacteria bacterium AqS2 ((Tethybacterales) were identified.
Keywords: Chondrillida; metagenome assembly; Halisarca caerulea; chromosomal; encrusting sponge; genome sequence.
Copyright: © 2025 de Goeij JM et al.
Conflict of interest statement
No competing interests were disclosed.
Figures


Similar articles
-
The chromosomal genome sequence of the kidney sponge, Chondrosia reniformis Nardo, 1847, and its associated microbial metagenome sequences.Wellcome Open Res. 2025 May 29;10:283. doi: 10.12688/wellcomeopenres.24166.1. eCollection 2025. Wellcome Open Res. 2025. PMID: 40548332 Free PMC article.
-
The chromosomal genome sequence of the giant barrel sponge, Xestospongia muta Schmidt 1870 and its associated microbial metagenome sequences.Wellcome Open Res. 2025 Jul 8;10:336. doi: 10.12688/wellcomeopenres.24173.1. eCollection 2025. Wellcome Open Res. 2025. PMID: 40894109 Free PMC article.
-
The chromosomal genome sequence of the marine leech, Branchellion lobata Moore, 1952 and its associated microbial metagenome sequences.Wellcome Open Res. 2025 Jun 2;10:304. doi: 10.12688/wellcomeopenres.24186.1. eCollection 2025. Wellcome Open Res. 2025. PMID: 40771652 Free PMC article.
-
[Volume and health outcomes: evidence from systematic reviews and from evaluation of Italian hospital data].Epidemiol Prev. 2013 Mar-Jun;37(2-3 Suppl 2):1-100. Epidemiol Prev. 2013. PMID: 23851286 Italian.
-
Single-incision sling operations for urinary incontinence in women.Cochrane Database Syst Rev. 2014 Jun 1;(6):CD008709. doi: 10.1002/14651858.CD008709.pub2. Cochrane Database Syst Rev. 2014. Update in: Cochrane Database Syst Rev. 2017 Jul 26;7:CD008709. doi: 10.1002/14651858.CD008709.pub3. PMID: 24880654 Updated.
References
LinkOut - more resources
Full Text Sources

