[Preprint]. 2025 Aug 22:2025.08.20.671298.
doi: 10.1101/2025.08.20.671298.

Single-Assay Characterization of Ternary Complex Assembly and Activity in Targeted Protein Degradation

Affiliations

Single-Assay Characterization of Ternary Complex Assembly and Activity in Targeted Protein Degradation

Corey H Yu et al. bioRxiv. .

Abstract

Targeted protein degradation (TPD) is a rapidly advancing therapeutic strategy that selectively eliminates disease-associated proteins by co-opting the cell's protein degradation machinery. Covalent modification of proteins with ubiquitin is a critical event in TPD, yet the analytical tools for quantifying the ubiquitination kinetics have been limited. Here, we present a real-time, high-throughput fluorescent assay utilizing purified, FRET-active E2-Ub conjugates to monitor ubiquitin transfer. This assay is highly versatile, requiring no engineering of the target protein or ligase, thereby accelerating assay development and minimizing the risk of artifacts. The single-step, single-turnover nature of the monitored reaction enables rigorous and quantitative analysis of ubiquitination kinetics. We show that this assay can be used to measure key degrader characteristics such as degrader affinity for the target protein, degrader affinity for the ligase, affinity of ternary complex assembly, and catalytic efficiency of the ternary complex. The high sensitivity and accuracy of this comprehensive, single-assay approach to ternary complex characterization will empower the discovery and optimization of heterobifunctional degraders and molecular glues.


Conflict of interest statement

Competing interests Pending patent applications PCT/US2022/048268, US 18/712304 and EU 22899266.5 list the Board of Regents, The University of Texas System as the applicant and D.N.I. as an inventor. D.N.I. is a co-founder and a shareholder of E3 Bioscience LLC, a commercial entity that manufactures reagents described in this study. All other authors declare no competing interests.

Figures

Figure 1.
Figure 1.. FRET-active E2–Ub conjugates enable real-time monitoring of E3-catalyzed ubiquitin transfer.
(A) Schematic of the FRET-based assay using a thioester conjugate of AF488-labeled ubiquitin and AF594-labeled UBE2N. (B) Reaction progress curves recorded by monitoring donor (read 1) and acceptor (read 2) fluorescence emission. Normalized FRET is calculated as the ratio of acceptor to donor fluorescence intensity at each time point. This normalization suppresses non-FRET-related variability due to pipetting or optical artifacts. (C,D) SDS-PAGE analysis of quenched reactions imaged for AF594 (C) and AF488 (D) fluorescence. (E) Overlay of normalized FRET decay curves (lines) and quantification of intact E2–Ub from SDS-PAGE (squares), confirming that FRET signal decay accurately reflects E2–Ub consumption.
Figure 2.
Figure 2.. Monitoring degrader-dependent ubiquitin transfer using FRET detection.
(A) Schematic of the FRET assay used to monitor dBET1-induced ubiquitination of BRD4 by the CRL4CRBN ligase. (B) Control reactions reveal background activity of neddylated Cul4A–Rbx1 that is independent of both substrate and degrader. (C) Degrader-dependent enhancement of FRET decay shows the characteristic hook effect of heterobifunctional degraders. (D) SDS-PAGE analysis of reaction products at the 1-hour timepoint. Gel imaged for fluorescein fluorescence using a Typhoon scanner. (E) FRET progress curves from 120 replicates for each of three sample compositions (I, II, III), dispensed into a 384-well plate using automated liquid handling. (F) Z′-factors calculated over time for individual reads and cumulative datasets.
Figure 3.
Figure 3.. Kinetic modeling of FRET decay rates.
(A) FRET decay progress curves from a dBET1 titration series monitoring BRD4 ubiquitination by CRL4CRBN. (B) In Michaelis–Menten kinetics, substrate depletion below Km is well approximated by a simple exponential decay. (C) Enzyme titration series under Michaelis–Menten conditions yield a family of exponential decay curves bounded by the same Fmax and Fmin values. (D) The differential equation describing time-dependent E3 ligase inactivation can be solved numerically to yield a theoretical substrate depletion curve. (E,F) Global least-squares fitting across the titration series determines best-fit model parameters, yielding excellent agreement between theory and experiment.
Figure 4.
Figure 4.. Quantitative analysis of ternary complex assembly using FRET-based ubiquitin transfer assay.
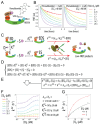
(A) Schematic of the reaction and binding equilibria underlying ternary complex formation by heterobifunctional degraders. (B) System of three mass conservation equations describing the equilibria depicted in panel A. (C) Ternary complex concentration [ESD] and its associated FRET decay rate kEDS are calculated by numerically solving the system of equations in panel B. (D) Experimental kEDS values obtained from degrader titration series at multiple substrate concentrations. The BD2 (aa 333-460) construct of BRD4 was used as ubiquitination substrate. (E,F) Nonlinear least-squares fitting of experimental (D) and modeled (C) kEDS values yields four parameters describing ternary complex assembly and activity kcat/Km, KdED, KdSD and KdEDS
Figure 5.
Figure 5.. Quantitative modeling of molecular glue activity in systems with non-negligible E3-substrate affinity.
(A) Recruitment of SALL4 to CRL4CRBN by thalidomide and its analogues is implicated in thalidomide embryopathy. (B) FRET progress curves for ubiquitination of SALL4405-432 at varying substrate concentrations in the absence (left) and presence (right) of 2 μM pomalidomide. (C) Schematic of binding equilibria contributing to both molecular glue–dependent and –independent ubiquitin transfer. (D) System of mass conservation equations describing the equilibrium distribution of ED, ES, and EDS complexes. (E) Model parameters are obtained by least-squares fitting of experimental kTot values to theoretical rates obtained by numerically solving the system in panel D. (F) Experimental kTot values (circles) and model predictions (lines) across substrate and degrader titration series. (G) Plotting kTot versus SALL4405-432 concentration for the 0 μM and 2 μM pomalidomide datasets illustrates an approximately 3-fold increase in ligase-substrate affinity upon pomalidomide addition.

References

    1. Komander D. & Rape M. The ubiquitin code. Annu Rev Biochem 81, 203–29 (2012). - PubMed
    1. Berndsen C.E. & Wolberger C. New insights into ubiquitin E3 ligase mechanism. Nat Struct Mol Biol 21, 301–7 (2014). - PubMed
    1. Franklin T.G. & Pruneda J.N. Observing Real-Time Ubiquitination in High Throughput with Fluorescence Polarization. Methods Mol Biol 2581, 3–12 (2023). - PMC - PubMed
    1. Wu K., Ching K., Chong R.A. & Pan Z.Q. A new FRET-based platform to track substrate ubiquitination by fluorescence. J Biol Chem 296, 100230 (2021). - PMC - PubMed
    1. Scott D.C. & Schulman B.A. Dual-color pulse-chase ubiquitination assays to simultaneously monitor substrate priming and extension. Methods Enzymol 618, 29–48 (2019). - PubMed

Publication types

LinkOut - more resources