[Preprint]. 2025 Aug 24:2025.08.19.670906.
doi: 10.1101/2025.08.19.670906.

A unified network systems approach uncovers a core novel program underlying T follicular helper cell differentiation

Affiliations

A unified network systems approach uncovers a core novel program underlying T follicular helper cell differentiation

Alisa A Omelchenko et al. bioRxiv. .

Abstract

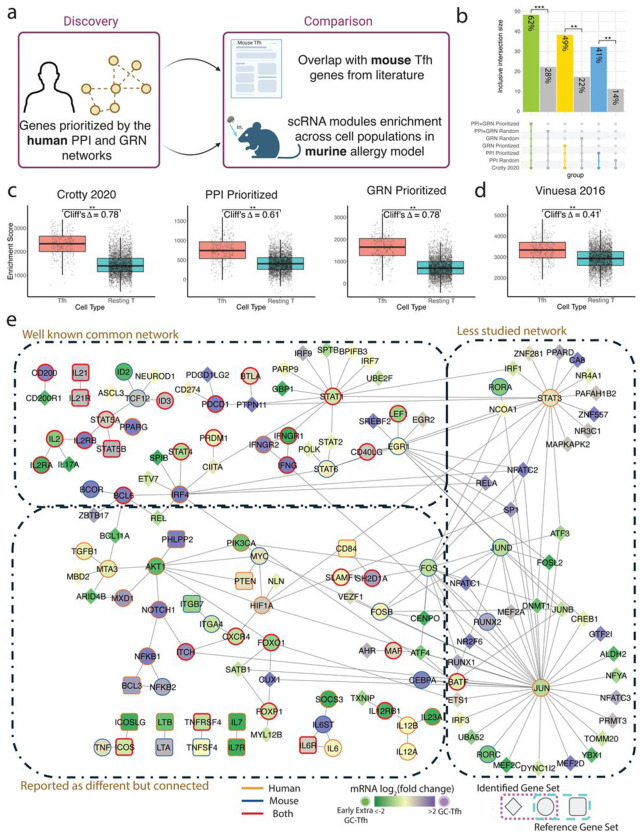
T follicular helper (Tfh) cells are central to the adaptive immune response and exhibit remarkable functional diversity and plasticity. The complex nature of Tfh cell populations, inconsistent findings across experimental systems and potential differences across species have fueled ongoing debate regarding core regulatory pathways that govern Tfh differentiation. Many studies have experimentally investigated individual proteins and circuits involved in Tfh differentiation in limited contexts, each providing only a partial understanding of the process. To address this, we adopted a novel multi-scale network systems approach that incorporates both regulatory and protein-protein interactions. Our approach integrates diverse data types, captures regulation across multiple levels of immune system organization, and recapitulates known drivers. Further, we discover a core Tfh gene set that is conserved across tissue types and disease contexts, and is consistent across data modalities - bulk, single-cell and spatial. While components of this set have been individually reported, a novel aspect of our work lies in the discovery, characterization, and connectivity of this core signature using a single unbiased approach. Using this method, we also uncover a novel function of IL-12, a molecule with reported conflicting functions, in the regulation of Tfh differentiation. Notably, we find that, in both humans and mice, IL-12 is permissive for the differentiation of Tfh precursors, but blocks subsequent differentiation into GC Tfh cells. Overall, this work elucidates novel networks with unexplored roles in governing Tfh cell differentiation across species and tissues, paving the way for novel -therapeutic interventions.


Figures

Extended Figure 1
Extended Figure 1
A. t-SNE visualizing epigenomic profiles (ATAC-seq, H3K4me1, H3K4me4, H3K27Ac) of samples at different stages in the Tfh cell differentiation trajectory. B. Heatmap visualizing differentially regulated regions for each of the 4 epigenomic datasets - ATAC-seq, H3K4me1, H3K4me4, H3K27Ac C. Schematic of a proximity-weighted count heuristic to calculate peak proximity scores. D. Relationship between PPS and transcript abundances at the Early Extra-GC Tfh state in Tfh differentiation (PPS threshold 20, transcript abundance threshold 5) E. Relationship between PPS and transcript abundances at the GC Tfh state in Tfh differentiation (PPS threshold 20, transcript abundance threshold 5)
Extended Figure 2
Extended Figure 2
A. All 27 modules identified with the protein-protein interaction network propagation colored by the mRNA log2FC of the GC and Early Extra-GC Tfh where higher expression in GC is shown in purple, and higher in Early Extra-GC Tfh is shown in Green. B. Overlay of the logFC RNA prioritized set with direct interactors on the Vinuesa 2016 reference network. Shared genes (circle) and reference only genes (square) are covered by mRNA log2FC as previously described. C. Overlap of size matched gene sets of log2FC RNA (left) and top PPS (right) with their firstdegree interactors with 2 reference Tfh sets. Size matched sets (184 genes) of the top log2FC RNA scores or PPS were identified and first degree interactors were added from the network. 1000 permutations of a random size matched sets (184 genes) with first degree interactors added were also compared for each analysis. Bi-nomial proportions test performed with average random overlap and average random set size, P-value threshold <0.05 D. A focused scatter plot on the driver TF set without ZNFs analyzed by Taiji given by the mRNA log2FC between the GC and Late Extra GC state (y-axis) and the Taiji Rank log2FC between the 2 states (x-axis) and colored by the mRNA log2FC of the GC and Late Extra-GC Tfh where higher expression in GC is shown in purple, and higher in Late Extra-GC Tfh is shown in Blue. E. Overlay of the PPI+GRN prioritized set with direct interactors on the Vinuesa 2016 reference network colored by mRNA log2FC of the GC and Late Extra-GC Tfh where higher expression in GC is shown in purple, and higher in Late Extra-GC Tfh is shown in Blue. Shared genes (circle), analysis only discovered interactors (diamond), and reference only genes (square).
Extended Figure 3
Extended Figure 3
A. IL21 connection to the rest of the Vinuesa genes through the SMARCA2 hub in the PPI network. The shortest path connecting all Vinuesa genes was used with all interactors of SMARCA2 visualized. Orange, in Vinuesa genes; grey, gene in the PPI network. B. CXCR5 connection to the rest of the Vinuesa genes through the GNAI2 hub in the PPI network. The shortest path connecting all Vinuesa genes was used with all interactors of GNAI2 visualized. Orange, in Vinuesa genes; grey, gene in the PPI network.
Extended Figure 4
Extended Figure 4
A. HALLMARK TNFA-SIGNALING-VIA-NFKB pathway PPI network visualization with the prioritized Tfh gene set overlaid. Shape and color as previously described. Shared genes (circle), analysis only discovered interactors (diamond), and reference only genes (square) are colored by mRNA log2FC as previously described. B. Volcano plot visualizing effect sizes and significance of functional overlaps between the Tfh identified gene set and KEGG pathways. Significant pathways colored in blue. Significant pathways colored in blue (−log(Q-value) > 0.7, log2(odds_ratio) > 0.58). Adjusted p-value (FDR) < 0.2, and 1.5-fold enrichment. C. Human scRNA top 15 KEGG pathways enriched for the Tfh identified gene set given by the top effect size between the Tfh and Th17 cell population enrichment scores. D. scGSEA enrichment of the CYTOKINE-CYTOKINE-RECEPTOR-INTERACTION KEGG pathway for Th17 and Tfh cell populations (Cliffs Δ = −0.55, p-value < 0.01).
Extended Figure 5
Extended Figure 5
a-c, B18+/− mice were given either heat killed (HK) STm control or STm infection, and immunized with NP-CGG in alum on day 0. Mice were additionally treated with neutralizing anti-IL-12 antibody beginning at day −1 or 3 (a-c), or day 7 or 11 (d,e). Tfh were analyzed at 12 days after infection/immunization. A. Representative FACS plots illustrating gating used to identify GC and non-GC Tfh among activated T conventional cells. B. Percentage of GC (CD90low) or non-GC (CD90high) Tfh (CXCR5high PD-1high) among activated T conventional cells, following IL-12 block at day −1 and 3. C. Number (left) and percentage (right) of total Tfh (CXCR5high PD-1high) following IL-12 block at day −1 and 3. D. Percentage of GC (CD90low) or non-GC (CD90high) Tfh (CXCR5high PD-1high) among activated T conventional cells following IL-12 block at day 7 or 11. E. Number (left) and percentage (right) of total Tfh (CXCR5high PD-1high) following IL-12 block at day 7 or 11.
Figure 1:
Figure 1:
A. Flow cytometry gating strategy to identify Tfh cells and their differentiation state from the 600 million human tonsil cells. B. Tfh cell differentiation trajectory of the 4 states identified through flow cytometry. C. Schematic displaying multi-omic datasets each providing a specific view of a system and how using networks as biological priors can integrate the views and identify a core program across different conditions such as species. D. Overview showing how novel targets were discovered using bulk datasets and refined using single cell and spatial data. Targets were then validated in a murine in-vivo model. E. Method for identification of top driver TFs through integration of the epigenomic/transcriptomic datasets with Personalized PageRank network propagation and filtering the output ranks. F. Protein-protein interaction network propagation using the gene centric peak proximity score (PPS) to integrate epigenomic datasets and identify significant subnetworks. G. Validation of bulk data results with single cell RNA (scRNA) datasets across contexts like disease and species through single cell gene set enrichment analysis (scGSEA).
Figure 2:
Figure 2:
A. The spread of the 1165 TFs analyzed by Taiji given by the mRNA log2FC between the GC and Early Extra GC state (y-axis) and the Taiji Rank log2FC between the 2 states (x-axis) with all TFs (grey), those which passed the p-value threshold of <0.01 (orange), and the chosen 152 driver TF set (blue). B. A focused scatter plot on the driver TF set without ZNFs analyzed by Taiji given by the mRNA log2FC between the GC and Early Extra GC state (y-axis) and the Taiji Rank log2FC between the 2 states (x-axis) and colored by the mRNA log2FC of the GC and Early Extra GC Tfh where higher expression in GC is shown in purple, and higher in Early Extra GC Tfh is shown in Green C. Visualization of 2000 random edges (module 28) and the subnetworks identified through the PPI network propagation (modules 1-27) showing specificity of the selected modules. D. Largest connected modules (>6 genes), colored by the mRNA log2FC as described in B. E. Overlap of size matched gene sets of log2FC RNA and top PPS with their first-degree interactors with 2 reference Tfh sets. Size matched sets (184 genes) of the top log2FC RNA scores or PPS were identified and first-degree interactors were added from the network. 1000 permutations of a random size matched sets were also compared for each analysis. Fisher’s exact test performed with average random overlap, P-value threshold <0.05. F. PPI, GRN, and PPI + GRN prioritized gene sets plus direct interactors overlap with 2 Tfh reference gene sets. 1000 permutations of a random size matched sets were also compared for each analysis. Fisher’s exact test performed with average random overlap, P-value threshold <0.05. G. Overlay of the PPI+GRN prioritized set with direct interactors on the Vinuesa 2016 reference network. Shared genes (circle), analysis only discovered interactors (diamond), and reference only genes (square) are colored by mRNA log2FC as previously described.
Figure 3:
Figure 3:
A. Illustration of the refinement analysis using a Tfh and non-Tfh cell population identification and gene set enrichment analysis for modules of interest. Cell populations were extracted from a human scRNA dataset composed of gut samples from people living with HIV (PLWHIV). B. UMAP visualizing scRNA clusters (top) made using shared nearest neighbor (SNN) graph construction and the Louvain algorithm, with parameters k.param= 50 and resolution = 0.7 based on the Harmony-reduced space. Tfh cell identification using Tfh Marker Gene Expression Score. C. Identification of non-Tfh populations from the scRNA clusters (top) after filtering and removing cell populations using the Central Memory (bottom left) and Th17 (bottom right) Marker Gene Expression Score. D. scRNA enrichment for CM non-Tfh CD4 and Tfh cell populations for PPI prioritized, GRN prioritized, Vinuesa 2016 published reference, and the Hart 2022 published reference gene sets (Cliffs Δ = 0.27, 0.15, −0.1, 0.05). Significance given by effect size (Cliffs Δ) ≥ 0.1 and p-value > 0.01. E. scRNA enrichment for Th1, GRN prioritized, Vinuesa 2016 published reference, Hart 2022 published reference gene sets (Cliffs Δ = 0.18, 0.1, 0.19, 0.18). Significance given by effect size (Cliffs Δ) ≥ 0.1 and p-value > 0.01. F. Schematic demonstrating the analysis of the human tonsil spatial dataset. G. scRNA enrichment for non-Tfh CD4+ and Tfh cell populations for PPI prioritized, Vinuesa 2016 published reference, and the Hart 2022 published reference gene sets (Cliffs Δ = 0.53, 0.41, 0.59). Significance given by effect size (Cliffs Δ) ≥ 0.1 and p-value > 0.01. H. 2D visualization of the spatial coordinates of non-Tfh CD4+ and Tfh cells colored by cell type. I. 2D visualization of the spatial coordinates of non-Tfh CD4+ and Tfh cells colored by enrichment score for the PPI prioritized, Vinuesa 2016 published reference, and Hart 2022 published reference gene sets.
Figure 4:
Figure 4:
A. Schematic of the experimental set up to identify commonalities between the human derived gene set to mouse networks across data modalities and allergy. B. PPI, GRN, and PPI + GRN prioritized gene sets plus direct interactors overlap with a mouse Tfh reference gene set. 1000 permutations of a random size matched sets were also compared for each analysis. P-value <0.001 and <0.01 respectively. C. scGSEA enrichment for Resting CD4 T-cell and Tfh cell populations for the 2020 murine published reference, PPI prioritized, GRN prioritized gene sets (Cliffs Δ = 0.78, 0.61, 0.78). Significance given by effect size (Cliffs Δ) ≥ 0.1 and p-value > 0.01.. D. scGSEA enrichment for Resting CD4 T-cell and Tfh cell populations for the 2016 human published reference (Cliffs Δ = 0.41). Significance given by effect size (Cliffs Δ) ≥ 0.1 and p-value > 0.01. E. Visualization of the identified core Tfh program across mouse and human datasets. Genes from the 2020, 2016, and 2022 references were pooled and the edges between the genes were provided by the PPI network. Shared mouse and human reference genes are outlined red while mouse reference only or human only were outlined in blue and orange respectively. The identified gene set was overlaid with this network and direct interactors were kept. Shared genes (circle), analysis only discovered interactors (diamond), and reference only genes (square) are covered by mRNA log2FC as previously described. The network was partitioned into 3 sections: well-known common network, less studied network, and reported as different but connected.
Figure 5:
Figure 5:
A. Volcano plot visualizing effect sizes and significance of functional overlaps between the Tfh identified gene set and Hallmark pathways. Significant pathways colored in blue (−log(Q-value) > 0.7, log2(odds_ratio) > 0.58). Adjusted p-value (FDR) < 0.2, and 1.5-fold enrichment. B. Human scRNA top 15 Hallmark pathways enriched for the Tfh identified gene set given by the top effect size between the Tfh and Th17 cell population enrichment scores. Pathways that were also identified in the volcano plot are highlighted in blue. C. scGSEA enrichment of the TNFA-SIGNALING-VIA-NFKB hallmark pathway for Th17 and Tfh cell populations (Cliffs Δ = −0.56, p-value < 0.01). D. Volcano plot visualizing effect sizes and significance of functional overlaps between the Tfh identified gene set and PID pathways. Significant pathways colored in blue. Significant pathways colored in blue (−log(Q-value) > 0.7, log2(odds_ratio) > 0.58). Adjusted p-value (FDR) < 0.2, and 1.5-fold enrichment. E. Human scRNA top 15 PID pathways enriched for the Tfh identified gene set given by the top effect size between the Tfh and Th17 cell population enrichment scores. F. scGSEA enrichment of the IL27 PID pathway for Th17 and Tfh cell populations (Cliffs Δ = −0.40, p-value < 0.01). G. PID IL-27 pathway PPI network visualization with the prioritized Tfh gene set overlaid. Shared genes (circle), analysis only discovered interactors (diamond), and reference only genes (square) are colored by mRNA log2FC as previously described. H. PID IL-23 pathway PPI network visualization with the prioritized Tfh gene set overlaid. Shape and color as previously described.
Figure 6:
Figure 6:
A. scGSEA enrichment of the IL-12 PID pathway pathway for Th17 and Tfh cell populations. Cliffs Δ = 0.56, p-value < 0.0001. B. PID IL-12 pathway protein protein interaction network visualization with the Tfh prioritized gene set overlaid. Red dashed line indicating interaction identified in submodule 1 (Figure 1). Shape and color as previously described. c-f, B18+/− mice were given either heat killed (HK) STm control or STm infection, and immunized with NP-CGG in alum on day 0. Mice were additionally treated with neutralizing anti-IL-12 antibodies (or vehicle control) beginning at day −1 or 3 (e), or day 7 or 11 (f). Tfh were analyzed at 12 days after infection/immunization. C. Experimental design for panels d and e. D. Representative FACS plots pre-gated on [singlet, live, CD45R−, CD4+, FoxP3−, CD44hi] activated T conventional cells. Shown are gates for total Tfh (CXCR5high PD-1high), and GC Tfh (CD90low) or non-GC Tfh (CD90high). E. Numbers of GC Tfh and non-GC Tfh per spleen. F. Numbers of GC and non-GC Tfh were quantified 12 days after infection as in d. For e-f charts, circles represent individual mice and bars the mean +/− SD. NS, not significant, * p<0.05, ** p<0.01, ***p<0.001, ****p<0.0001. P values were calculated using two-tailed t tests.

References

    1. Cosmi L., Maggi L., Santarlasci V., Liotta F. & Annunziato F. T helper cells plasticity in inflammation: T Helper Cells Plasticity in Inflammation. Cytometry A 85, 36–42 (2014). - PubMed
    1. Stubbington M. J. T., Rozenblatt-Rosen O., Regev A. & Teichmann S. A. Single-cell transcriptomics to explore the immune system in health and disease. Science 358, 58–63 (2017). - PMC - PubMed
    1. Zhou L., Chong M. M. W. & Littman D. R. Plasticity of CD4+ T cell lineage differentiation. Immunity 30, 646–655 (2009). - PubMed
    1. Ruterbusch M., Pruner K. B., Shehata L. & Pepper M. In vivo CD4+ T cell differentiation and function: Revisiting the Th1/Th2 paradigm. Annu. Rev. Immunol. 38, 705–725 (2020). - PubMed
    1. Ma C. S. et al. Unique and shared signaling pathways cooperate to regulate the differentiation of human CD4+ T cells into distinct effector subsets. J. Exp. Med. 213, 1589–1608 (2016). - PMC - PubMed

Publication types

LinkOut - more resources