[Preprint]. 2025 Aug 22:2025.08.21.671508.
doi: 10.1101/2025.08.21.671508.

Evolution of Cajal-Retzius Cells in Vertebrates from an Ancient Class of Tp73+ Neurons

Affiliations

Evolution of Cajal-Retzius Cells in Vertebrates from an Ancient Class of Tp73+ Neurons

Elias Gumnit et al. bioRxiv. .

Abstract

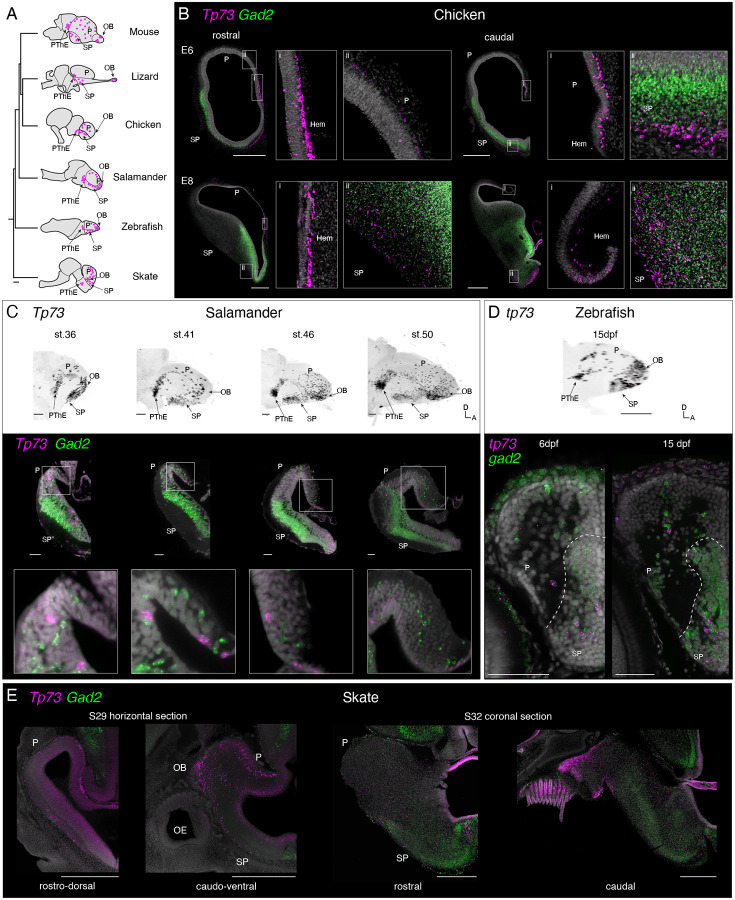
In the developing cerebral cortex, Cajal Retzius (CR) cells are early-born neurons that orchestrate the development of mammalian-specific cortical features. However, this cell type has not been conclusively identified in non-mammalian species. Here we studied neurons expressing Tp73, a transcription factor specifically expressed in most mammalian CR cells. Comparisons of chicken, salamander, zebrafish, and little skate data indicate that Tp73-expressing neurons have conserved spatial distribution and transcriptomic signatures in vertebrates. Among the conserved Tp73-expressing cell types we find CR cells andTp73+ external tufted cells (ETCs) in the olfactory bulb of jawed vertebrates. ETCs and CR cells share the expression of most "canonical" CR cell transcription factors, such as Tp73, Lhx1, Lhx5, Ebf3, and Nr2f2, indicating that they are sister cell types. Our findings suggest that CR and ETCs evolved in stem vertebrates from cells involved in olfactory processing, with CR cells progressively acquiring new specialized roles in developmental signaling.


Figures

Fig. 1.
Fig. 1.. Conserved Tp73 expression in vertebrate forebrains.
(A) Distribution of Tp73 neurons in vertebrate brains, according to published data and this study. Scale bar: 100 million years. (B) Double HCRs for Tp73 (magenta) and Gad2 (green) in coronal sections of chick brains (embryonic stages E6 and E8), showing Tp73 expression in the developing hem, pallium, and subpallium. Gad2 labels GABAergic neurons and helps identify the pallial-subpallial boundary. Scale bars = 500 um. (C) Top: 3D max intensity projections (lateral views, anterior on the right) of salamander brains (larval stages 36, 41, 46, and 50) after whole mount HCR for Tp73. Scale bar 100um. Bottom: optical coronal sections through one telencephalic hemisphere of Tp73 and Gad2-labeled brains at different developmental stages; insets show Tp73+ and Gad2+ neurons in pallium. Scale bar 50 um. (D) 3D max intensity projection of a whole mount 15 dpf zebrafish brain (lateral view, anterior on the right) after HCR for tp73. Scale bar 100 um. Bottom: sections of tp73 and gad2-labeled 6 dpf and 15dpf zebrafish brains showing tp73+ and gad2+ neurons in pallium and subpallium. Scale bar 50 um. (E) Expression of Tp73 and Gad2 in the developing skate brain. Left: horizontal sections of stage 29 brains; right: coronal sections of stage 32 brains. Scale bar 500um. See additional sections in fig. S1. Abbreviations: E, embryonic day; P, pallium; SP, subpallium; OB, olfactory bulb; OE, olfactory epithelium; PThE, prethalamic eminence; dpf, days post fertilization; A, anterior; D, dorsal.
Fig. 2.
Fig. 2.. Mouse, salamander, and zebrafish Tp73+ neurons have a shared transcriptomic signature.
(A) UMAP of the Deryckere et al. (35) scRNA-seq dataset from the developing salamander brain (n=127,788 cells), showing cells colored by broad class. (B) Left: UMAP showing Tp73 expression in the developing salamander brain dataset. Right: Zoom on Tp73+ neurons, showing the expression of known CR marker TFs (5) (fig. S3A for full UMAPs of zoomed genes). (C) Pairwise GSI correlations of classes of salamander and mouse forebrain neurons (mouse data from (36)). Correlations based on the intersection of genes that were differentially expressed in both mouse and salamander (344 total genes). Dots indicate statistically significant correlations. (D) UMAP showing forebrain neurons from developing salamander and mouse after Seurat CCA integration. Salamander Tp73+ neurons and mouse CR cells highlighted in green and magenta, respectively. Right: Zoom on integrated cluster 18 containing salamander Tp73 neurons and mouse CR cells. (E) UMAP of the Pandey et al 2023 (39) dataset from the developing zebrafish telencephalon (n=23,044 cells, stages 6 and 15 dpf only), showing cells colored by type. (F) Left: UMAP showing lhx1a expression in the larval zebrafish dataset. Right: Zoom on zebrafish OB neurons showing expression of lhx1a and other CR TFs. (G) Pairwise GSI correlations of classes of salamander and zebrafish forebrain neurons. Correlations based on the intersection of genes that were differentially expressed in both zebrafish and salamander (149 total genes). Dots indicate statistically significant correlations. (H) UMAP showing forebrain neurons from developing salamander and zebrafish after Seurat CCA integration. Right: Zoom on integrated cluster 48 containing salamander Tp73 neurons and zebrafish OB cells. Abbreviations: BC, blood cells; CH/FB, chondrocytes/fibroblasts; EC, epithelial cells; Dien, diencephalon; GABA, GABAergic; Glut, glutamatergic; GSI, gene specificity index; ImN, immature neurons; MatN, mature neurons; MG, microglia; OEC, olfactory ensheathing cells; OPC/Olig, oligodendrocyte precursor cells/oligodendrocytes; P, pallium; PVM, perivascular macrophages; PR, photoreceptor cells; RG, radial glia; SP, subpallium; Telen, telencephalon; VC, vascular cells; see also Fig. 1.
Fig. 3.
Fig. 3.. Transcriptomic and spatial heterogeneity of salamander Tp73+ neurons
(A) UMAPs of the salamander Tp73+ neurons dataset (n= 982 cells). Left: Tp73+ neurons colored by cluster. Right: Tp73+ neurons colored by dataset (adult from (41)), and expression of Snap25 and Mki67. (B) Violin plots showing the expression of marker genes for Tp73 neuronal clusters; m1 and m2 populations express different sets of markers. (C)-(D) Closeups showing coexpression of Tp73 and selected marker genes detected by HCR in late active larvae (stages 46–55; see fig S8 for full images). (C) Top: coexpression of Stk32a and Tp73 in PthE and subpallium but not in OB and hem/pallium. Bottom: Ebf3 and Tp73 coexpression in OB and hem/pallium but not subpallium and PThEregions. Scale bar 10um. (D) Top: coexpression of Nfix and Tp73 in pallium but not OB. Bottom: coexpression of Asic4 and Tp73 in OB but not hem. Scale bar: 10 um. Abbreviations: im, immature; m, mature; see also Figure 1.
Fig. 4.
Fig. 4.. Transcriptomic similarity of CR and Tp73+ external tufted cells in mouse and salamander.
(A) UMAP of the mouse Allen Brain Cell atlas (34), highlighting the Tp73+ cells used for further analysis. (B-D) UMAPs showing salamander and mouse Tp73+ neurons after Seurat CCA integration, with cells colored by species (B), original neuron type annotation (C), and integrated cluster (D). (E) Matrix showing the percentage of cells of each Tp73 type (original annotations, rows) included the new integrated clusters (columns). (F) Pairwise GSI correlations of mouse and salamander Tp73+ types. Correlations based on the intersection of genes differentially expressed in both mouse and salamander (647 total). Dots indicate statistically significant correlations. (G). Tp73+ neurons in the OB glomerular layer of mouse (adult), salamander (adult), bichir fish (adult), zebrafish (3 mpf), and skate (adult). Mouse Trp73 colorimetric in situ hybridization adapted from mouse Allen Mouse Brain Atlas, mouse.brain-map.org and atlas.brain-map.org (43). All other images are Tp73 HCRs. Full image scale bars 200um. Zoom scale bars 10um. (H) Violin plots showing expression of TFs expressed in mouse CR cells and ETC but not in an outgroup (OB mitral/tufted cells), and the expression of the same TFs in other vertebrate species. (I) Violin plots showing expression of TFs expressed in CR cells but not in ETCs in both mouse and salamander, and the expression of the same TFs in chick and zebrafish. Data from (34, 35, 39, 41, 47) (see Methods for details). Abbreviations: BF, basal forebrain; ETC, external tufted cells; GL, glomerular layer; see also Figures 1, 2, and 3.
Fig. 5.
Fig. 5.. Transcriptomic divergence of vertebrate CR cells.
(A) HCRs showing Reln (green) and Tp73 (magenta) expression on coronal sections of developing stage E6 chick, st.50 salamander and 6 dpf zebrafish brains, and an horizontal section of a stage 29 skate brain. Closed arrowheads indicate examples of Tp73+ Reln+ cells. Open arrowheads indicate examples of Tp73+ Reln-negative cells. Scale bar 50um (Coronal Section) 10 um (Zoom Panel). (B) Expression of marker genes that differentiate CR cells from other pallial glutamatergic neurons (ETCs excluded) in mouse and salamander developmental datasets. The plot shows the top 20 genes enriched in mouse but not salamander CR cells; the top 20 genes enriched in both species, and the top 20 enriched in salamander but not mouse CR cells (see Methods). Mouse data from Moreau et al 2021 and Moreau et al 2023 (25, 29). (C) Quantification of the density of Tp73+ cells in salamander medial and dorsal pallium across developmental stages. Black dot represents average value. n= 3 animals for stages 36–50 and adult, n=2 for stage 53. (D) Proposed evolutionary relationship between CR cells and ETCs. Vertebrate phylogenetic tree with cell type typogenetic tree superimposed (inspired by(71)). Schematics of ETC and CR cells (dorsal view) based on(72, 73). Dotted circle represents OB glomerulus. Abbreviations: DP, dorsal pallium; LP, lateral pallium; MP, medial pallium; VP, ventral pallium

Similar articles

References

    1. García-Moreno F., Molnár Z., Variations of telencephalic development that paved the way for neocortical evolution. Prog. Neurobiol. 194, 101865 (2020). - PMC - PubMed
    1. Goffinet A. M., The evolution of cortical development: the synapsid-diapsid divergence. Development 144, 4061–4077 (2017). - PubMed
    1. Elorriaga V., Pierani A., Causeret F., Cajal-retzius cells: Recent advances in identity and function. Curr. Opin. Neurobiol. 79, 102686 (2023). - PubMed
    1. Kirischuk S., Luhmann H. J., Kilb W., Cajal-Retzius cells: update on structural and functional properties of these mystic neurons that bridged the 20th century. Neuroscience 275, 33–46 (2014). - PubMed
    1. Causeret F., Moreau M. X., Pierani A., Blanquie O., The multiple facets of Cajal-Retzius neurons. Development 148, dev199409 (2021). - PubMed

Publication types

LinkOut - more resources