[Preprint]. 2025 Aug 21:2025.08.15.670530.
doi: 10.1101/2025.08.15.670530.

MYC and Epithelial to Mesenchymal Transition (EMT) Independently Predict Circadian Rhythm Disruption in Lung Adenocarcinoma

Affiliations

MYC and Epithelial to Mesenchymal Transition (EMT) Independently Predict Circadian Rhythm Disruption in Lung Adenocarcinoma

Jamison B Burchett et al. bioRxiv. .

Abstract

The molecular circadian clock is known to be disrupted in lung adenocarcinoma, and its disruption is pro-tumorigenic in mouse models of this disease. However, the determinants of disruption of the molecular clock in human cancer are not clear. We hypothesized that derangement in expression of specific circadian clock genes or elevated MYC expression could correlate with circadian disruption in human tumors, and used Clock Correlation Distance (CCD) to compare clock order and strength in tumors based on the expression of these genes. While the expression of individual circadian genes did not consistently correlate with disruption, tumors with the highest expression of MYC or high MYC pathway activation had significantly disrupted rhythms compared to those with lower MYC. Unexpectedly, a subset of tumors with very low levels of MYC, below that found in normal lung, also showed disruption of circadian rhythms, prompting us to explore novel determinants of disruption in these tumors. We found that expression of programs associated with epithelial to mesenchymal Transition (EMT) and TGF-β signaling were enriched in tumors with the lowest MYC expression, and that, surprisingly, those tumors with a mesenchymal expression pattern had more ordered (stronger) rhythms. To directly test this correlation between cell state and rhythms, we exposed lung adenocarcinoma cells to TGF- β to induce EMT. TGF- β induced a quasi-mesenchymal phenotype and caused a significant increase in the amplitude of oscillations in these cells. Together, our data show that MYC expression, pathway activation, and a mesenchymal cell state are both independent determinants of circadian status in lung adenocarcinoma.


Figures

Figure 1:
Figure 1:. The circadian clock is disrupted in lung cancer, and molecular clock genes correlate with survival.
A.) The Clock Correlation Distance (CCD) reference plot (Left) showing the spearman correlation between the core clock genes. (Right) Spearman correlation maps generated through CCD of normal lung tissue samples and lung tumor samples. Samples N’s, calculated CCD scores, deltaCCD scores, and p-values are detailed next to the correlation maps. B.) Kaplan-Meyer plots of lung adenocarcinoma patient survival comparing groups within the upper vs lower third of BMAL1, REV-ERBα (NR1D1), PER2, and CRY1 expression. Plots have reported Hazard Ratio (HR), and logrank P value with a P-value <0.05 determined to be significant.
Figure 2:
Figure 2:. Expression of circadian genes vary across tumors, but this variation does not correlate to circadian disruption.
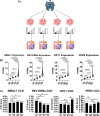
A.) A schematic showing the breakdown of tumor samples into groups based on their expression of a target gene and then running CCD on each separate group for comparison. B.) Violin plots of expression using Fragments per kilobase per million (FPKM) values for BMAL1, REV-ERBα (NR1D1), CRY1, and PER2 with median expression represented with a dotted line. Statistical difference between quartiles was determined by ordinary one-way ANOVA. **** = p<0.0001. C.) A bar chart representing the CCD scores for each quartile of expression for BMAL1, REV-ERBα, PER2, and CRY1. Significance was determined by sample label permutation performed by the deltaCCD package. Ns= Non-significance, * = p<0.05.
Figure 3:
Figure 3:. MYC oncogene expression and pathway can be used as a marker for circadian disruption.
A.) Western blot of protein levels of MYC-ER and BMAL1 in human lung cancer cell lines A549 and H1299 with total protein. MYC-ER cells were treated with 4OHT (MYC-ER-ON) or EtOH (MYC-ER-OFF) for 48 hours and dexamethasone for 24 hours before protein harvest. Total protein is used as a loading control. Relative protein expression for both MYC-ER and BMAL1 in both cell lines are represented by bar charts, normalized by total protein. N = 3 biological replicates, statistical difference was determined by Welch’s T-Test. * = p<0.05, **** = p<0.0001, and data shown are representative of 3 independent experiments. B.) A violin plot of C-MYC expression using FPKM values for normal tissue samples and tumor samples previously divided into expression quartiles. Statistical difference between quartiles was determined by ordinary one-way ANOVA. **** = p<0.0001. C.) A bar chart showing the combined expression of all three types of MYC (C-, N-, and L-) in quartiles illustrating the contribution of each type of MYC to the total. D.) A bar chart representing the CCD-values of C-MYC quartiles. Significance was determined by sample label permutation performed by the deltaCCD package. Ns= non-significance, * = p<0.05. E.) A bar chart representing the CCD-values of MYC_SUM quartiles. Significance was determined by sample label permutation performed by the deltaCCD package. Ns= Non-significance, * = p<0.05. F.) A bar chart representing the CCD-values for the Hallmarks MYC Targets V1 enrichment quartiles. Significance was determined by sample label permutation performed by the deltaCCD package. * = p<0.05.
Figure 4:
Figure 4:. Epithelial to mesenchymal transition and TGF-β Signaling negatively correlate to circadian disorder.
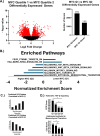
A.) Left Panel: A volcano plot shows the Log2 fold change of differentially expressed genes between the LUAD tumor samples in MYC_SUM quartile 1 and 2. All genes with a q-value below 0.05 are colored red. Right Panel: A bar chart representing the number of genes significantly differentially expressed between the two quartiles. B.) A bar chart of normalized enrichment scores for significantly differently enriched pathways identified through GSEA between MYC expression quartiles 1 and 2. C.) Predicted patterns of CCD scores if the tested pathway could be correlated with the disruption observed in MYC quartile 1 based on which MYC quartile the pathway is enriched in. D.) Bar charts of Hallmarks TGF-β Signaling and Hallmarks Epithelial to Mesenchymal Transition CCD scores based on enrichment quartiles of the respective pathway. Significance was determined by sample label permutation performed by the deltaCCD package. * = p<0.05.
Figure 5:
Figure 5:. Treatment of CMT64 LUAD cells with TGF-β induces partial EMT and strengthens oscillations of BMAL1.
A.) Top Row: Representative images of control CMT64. Bottom Row: Representative images of CMT64 cells that have been treated with 5ng/mL of TGF-β for 72 hours. B.) A bar chart of fold change in EMT marker SNAIL expression measured through qPCR in control CMT64 cells compared to cells exposed to 5ng/mL TGF-β for 72 hours with TBP used as a housekeeping gene. Significance was determined through Welch’s T-test. **** = p<0.0001. Error bars represent standard error of the mean. C.) A bar chart representing average roughness scores of control CMT64 cells and CMT64 cells treated with 5ng/mL TGF-β for 1, 2, and 3 days following treatment. Significance was determined by Welch’s T-test. * = p<0.05. Error bars represent standard error of the mean. D.) Western blot showing protein levels of E-Cadherin in CMT64 cells that were either control, treated with 5ng/mL TGF-β for 24 hours, or 5ng/mL TGF-β for 72 hours, compared with total protein as a loading control. E.) Lumicycle analysis of control CMT64 BMAL::LUC cells compared to those exposed to 5ng/mL TGF-β for 72 hours prior to being placed in the lumicycle. Oscillations are represented by plotting the luminescence over time with error bars representing the standard error of the mean. Calculated average amplitude is represented in a bar chart and significance was determined using a Welch’s T-test. * = p<0.05. Error bars represent standard error of the mean. For (B-E), N = 3 biological replicates and data are representative of 2–3 independent experiments.

Similar articles

References

    1. Solt L.A., Wang Y., Banerjee S., Hughes T., Kojetin D.J., Lundasen T., Shin Y., Liu J., Cameron M.D., Noel R. et al. (2012) Regulation of circadian behaviour and metabolism by synthetic REV-ERB agonists. Nature, 485, 62–68. - PMC - PubMed
    1. Masri S., Papagiannakopoulos T., Kinouchi K., Liu Y., Cervantes M., Baldi P., Jacks T. and Sassone-Corsi P. (2016) Lung Adenocarcinoma Distally Rewires Hepatic Circadian Homeostasis. Cell, 165, 896–909. - PMC - PubMed
    1. Lee Y., Lahens N.F., Zhang S., Bedont J., Field J.M. and Sehgal A. (2019) G1/S cell cycle regulators mediate effects of circadian dysregulation on tumor growth and provide targets for timed anticancer treatment. PLoS Biol, 17, e3000228. - PMC - PubMed
    1. Kettner N.M., Voicu H., Finegold M.J., Coarfa C., Sreekumar A., Putluri N., Katchy C.A., Lee C., Moore D.D. and Fu L. (2016) Circadian Homeostasis of Liver Metabolism Suppresses Hepatocarcinogenesis. Cancer Cell, 30, 909–924. - PMC - PubMed
    1. Cho H., Zhao X., Hatori M., Yu R.T., Barish G.D., Lam M.T., Chong L.W., DiTacchio L., Atkins A.R., Glass C.K. et al. (2012) Regulation of circadian behaviour and metabolism by REV-ERB-alpha and REV-ERB-beta. Nature, 485, 123–127. - PMC - PubMed

Publication types

LinkOut - more resources